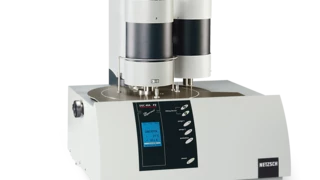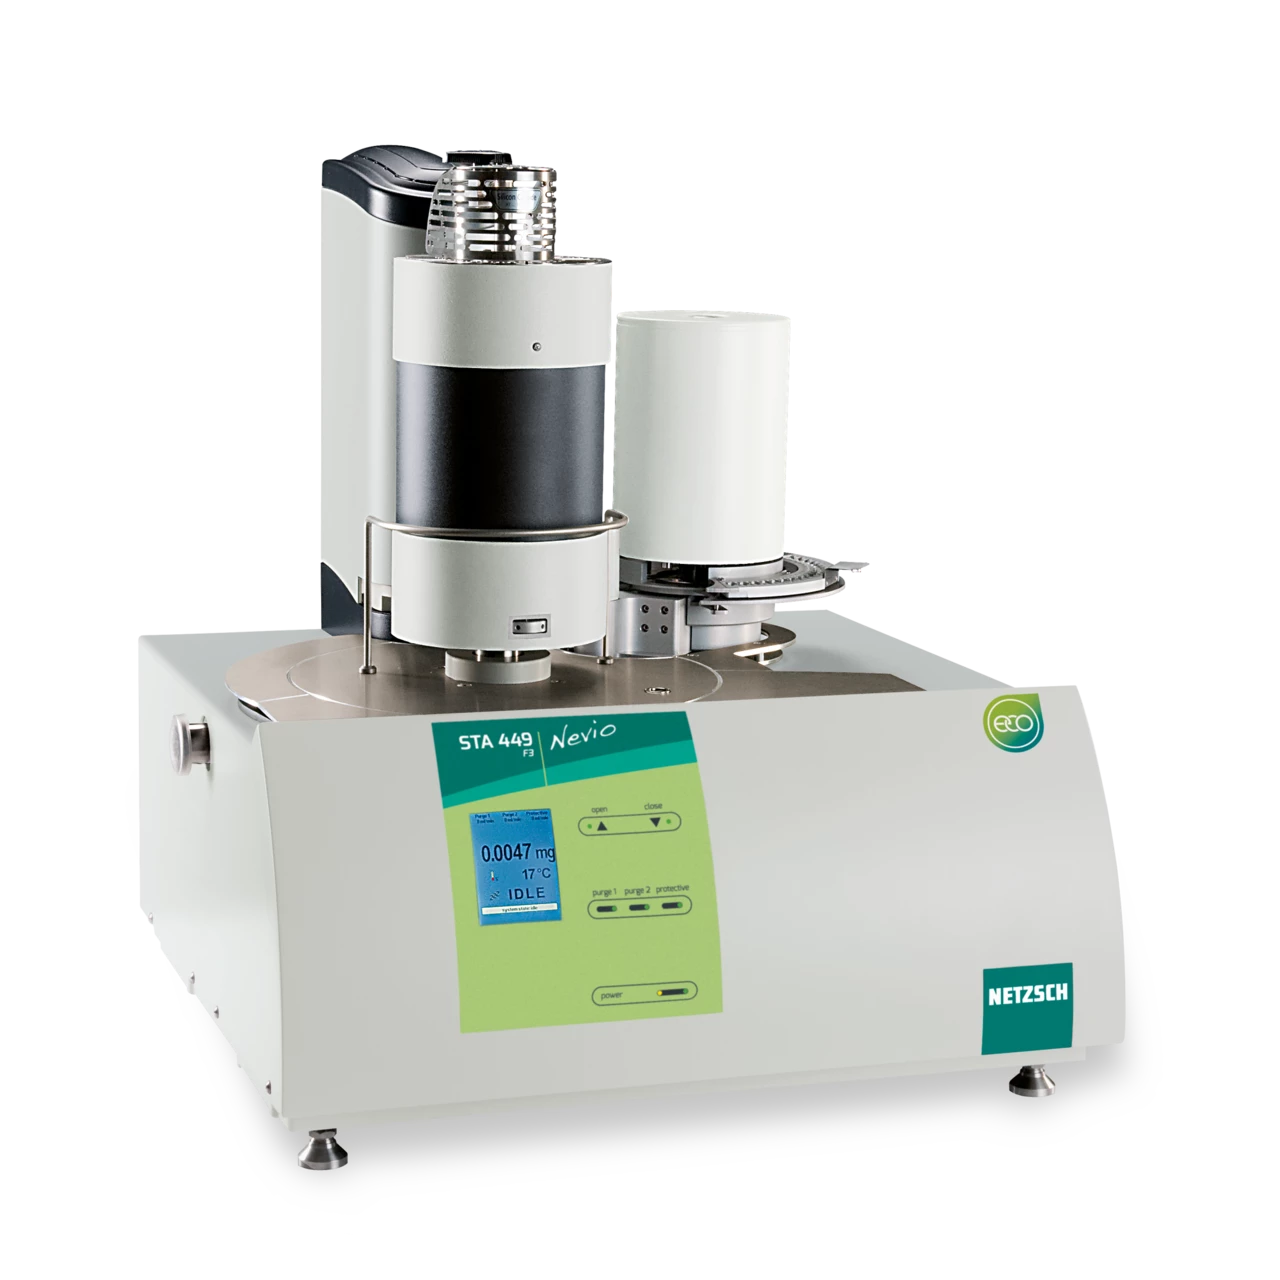
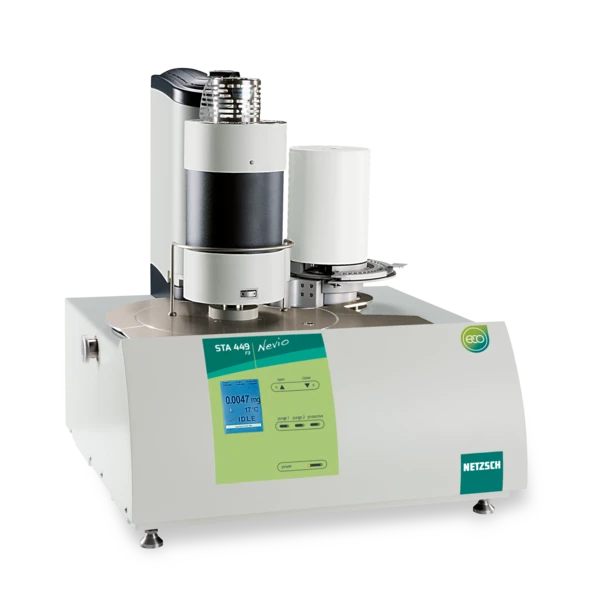
STA 449 F3 Nevio
Specialized for Demanding Tasks in Research & Development
The simultaneous thermal analyzer NETZSCH STA 449 F3 Nevio allows the measurement of mass changes and thermal effects under identical conditions at the same specimen.
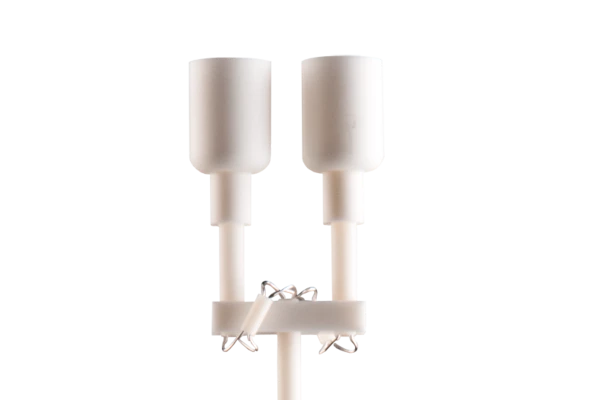
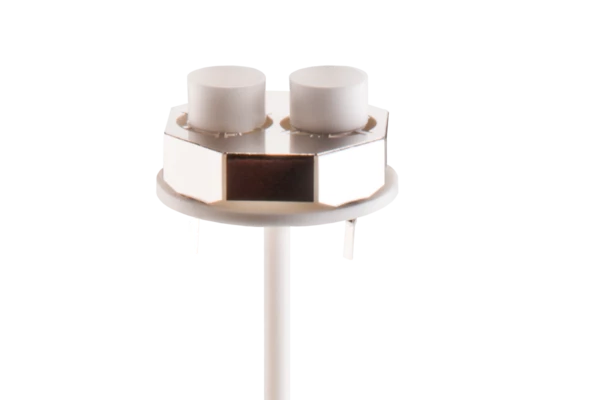
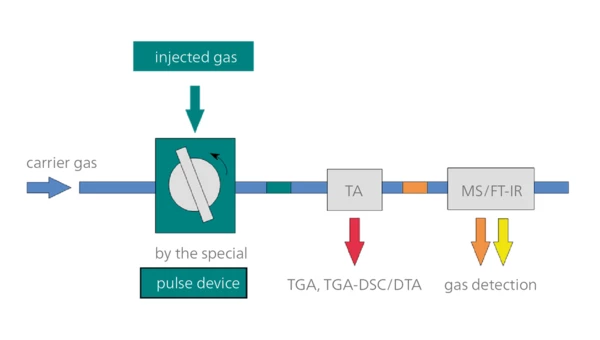
Thus it makes it feasible to differentiate between e.g., structural changes and degradation phenomena within just one measurement up to 675°C1. The high flexibility caused by the various sensors, the great variety of sample crucibles and the wide TGA-measuring range make the system applicable for analysis of different kinds of pharmaceuticals, cosmetic samples or food including also inhomogenous substances. The vacuum-tight design of the instrument is an essential requirement for evolved gas analysis, i.e., the coupling of the thermal analyzer to a gas analyzing system such as FT-IR, MS or GC-MS.
Various furnaces, easy interchangeable by the user, cover a very broad temperature range (please see accessories). In addition, due to its modular setup the STA 449 F3 Nevio is also prepared to investigate samples under defined humid atmosphere. The analysis of measuring data runs under a standard PC and the innovative NETZSCH Proteus® software.
1⁾ optimized temperature range for pharmacy, cosmetics and foodstuffs; depending on the selected furnaces: total temperature range: -150°C up to 2400°C

Request a Quote
Technical Data
Temperature range
max. heating and cooling rates
max. measuring and weighing range
Enthalpy accuracy:
± 1 ... 3 %
TG resolution:
0.1 µg (over entire weighing range)
Cooling options:
compressed air (<0°C to 675°C 1)), liquid nitrogen (-150°C to 675°C 1))
Atmospheres:
inert, oxidizing, reducing (forming gas), humid, vacuum, static, dynamic
Vacuum-tight:
Yes
1) optimized temperature range for pharmacy, cosmetics and foodstuffs; depending on the selected furnaces: total temperature range: -150°C up to 2400°C
2) minus weight of crucible
3) for thermocouple type E
This instrument is LabV®®️-primed
LabV®®️ takes the data from your analytical instrument: It automatically imports all measurement data into a central and secure database solution, the LabV®®️ software. This allows you to visualize the data in LabV®®️ and to make them searchable. Your data will now be accessible from anywhere. Moreover you have the possibility to generate reports.

Application Literature