Полимеры
Analysis of Ethylene Vinyl Acetate (EVA) (TGA-FT-IR)
The 3-D plot shows a TGA-FT-IR measurement on an EVA sample between 25°C and 600°C.
The mass-loss steps of the EVA sample (TGA, black curve) correlate well with the absorption intensities between 650 cm-1 and 4000 cm-1. The evolved gases as 2-dimensional spectra can be extracted at any desired temperature and subjected to a library search (e.g., NIST-EPA library for evolved gases) for identification.
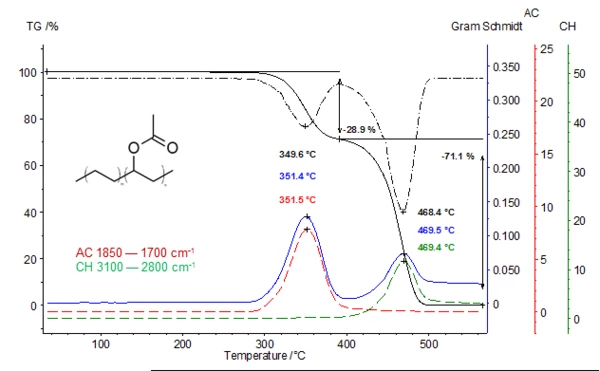
The lower plot shows the TGA (black), DTGA (black dashed) and the Gram-Schmidt graph (blue). The two additional extracted traces (temperature-dependent intensities; red and green curves) are in very good correlation with the DTGA curve. The 1st mass-loss step at 350°C is due to the release of acetic acid (red curve). In the 2nd mass-loss step, acetic acid has already been totally released. The green curve represents the absorption intensities of the released hydrocarbons resulting from the decomposition of the polymer backbone (DTGA peak at 468°C).
*Gram-Schmidt: Total intensity of the obtained infrared spectra of the gases released