Introduction
In the USA, when a manufacturer wants to create a generic version of an off patent drug, it needs to fulfill several requirements issued by the US Food and Drug Administration (FDA1). These include Q1, Q2 and Q3 steps, where Q1 shows that the new drug contains the same components as the Reference Listed Drug (RLD). Q2 shows that these components are in the same composition and quantities ±5% and Q3 shows that they have the same physical properties such as particle size, rheology, polymorphic form, etc. The particle size distribution and rheology need to approximately match those of the original innovator drug (OID) because the absorption time and characteristics of a topical cream are closely related to the products particle size and rheology, where smaller particles and lower viscosity materials allow faster absorption.
1 This application note should not be construed to represent US FDA’s views or policies.

Rheological Characterization
The rheological characterization includes yield StressStress is defined as a level of force applied on a sample with a well-defined cross section. (Stress = force/area). Samples having a circular or rectangular cross section can be compressed or stretched. Elastic materials like rubber can be stretched up to 5 to 10 times their original length.stress, viscosity flow curve and the viscoelastic properties (measurements in oscillation mode) to demonstrate that a new formulation is going to perform in approximately the same way as the OID. Several examples of such investigations will be presented on the following pages. Other tests may also be helpful but are not mandatory, such as the Thermal StabilityA material is thermally stable if it does not decompose under the influence of temperature. One way to determine the thermal stability of a substance is to use a TGA (thermogravimetric analyzer). thermal stability (freeze-thaw, hot-cold climate) as shown in section C3, and the rebuild time after shearing. These tests can also be carried out with a NETZSCH Kinexus rheometer and sometimes even on just one sample loading.
Several examples of such investigations will be presented on the following pages. Other tests may also be helpful but are not mandatory, such as the Thermal StabilityA material is thermally stable if it does not decompose under the influence of temperature. One way to determine the thermal stability of a substance is to use a TGA (thermogravimetric analyzer). thermal stability (freeze-thaw, hot-cold climate) as shown in section C3, and the rebuild time after shearing. These tests can also be carried out with a NETZSCH Kinexus rheometer and sometimes even on just one sample loading.
A1) Determining Yield Stress in Topical Creams
Introduction
The yield StressStress is defined as a level of force applied on a sample with a well-defined cross section. (Stress = force/area). Samples having a circular or rectangular cross section can be compressed or stretched. Elastic materials like rubber can be stretched up to 5 to 10 times their original length.stress of a material is the StressStress is defined as a level of force applied on a sample with a well-defined cross section. (Stress = force/area). Samples having a circular or rectangular cross section can be compressed or stretched. Elastic materials like rubber can be stretched up to 5 to 10 times their original length.stress required to start it flowing and relates to it’s consistency while at rest, resistance to sedimentation in storage, as well as the pressure needed to pump or spread the material. On application of StressStress is defined as a level of force applied on a sample with a well-defined cross section. (Stress = force/area). Samples having a circular or rectangular cross section can be compressed or stretched. Elastic materials like rubber can be stretched up to 5 to 10 times their original length.stress, a sample with a yield StressStress is defined as a level of force applied on a sample with a well-defined cross section. (Stress = force/area). Samples having a circular or rectangular cross section can be compressed or stretched. Elastic materials like rubber can be stretched up to 5 to 10 times their original length.stress initially acts as an elastic solid. The instantaneous viscosity appears to increase, as the more StressStress is defined as a level of force applied on a sample with a well-defined cross section. (Stress = force/area). Samples having a circular or rectangular cross section can be compressed or stretched. Elastic materials like rubber can be stretched up to 5 to 10 times their original length.stress that is applied to the sample, the more the sample resists flowing. When the yield StressStress is defined as a level of force applied on a sample with a well-defined cross section. (Stress = force/area). Samples having a circular or rectangular cross section can be compressed or stretched. Elastic materials like rubber can be stretched up to 5 to 10 times their original length.stress is reached, the sample starts to flow and the measured viscosity falls rapidly. The peak of the viscosity curve therefore indicates the yield StressStress is defined as a level of force applied on a sample with a well-defined cross section. (Stress = force/area). Samples having a circular or rectangular cross section can be compressed or stretched. Elastic materials like rubber can be stretched up to 5 to 10 times their original length.stress of the sample.
Interpretation
The conditions for the results displayed in Figure 1 are summarized in Table 1. Figure 1, sample A, showed a yield StressStress is defined as a level of force applied on a sample with a well-defined cross section. (Stress = force/area). Samples having a circular or rectangular cross section can be compressed or stretched. Elastic materials like rubber can be stretched up to 5 to 10 times their original length.stress of 100 Pa and will therefore resist pumping or flow slightly more than sample B which showed a yield StressStress is defined as a level of force applied on a sample with a well-defined cross section. (Stress = force/area). Samples having a circular or rectangular cross section can be compressed or stretched. Elastic materials like rubber can be stretched up to 5 to 10 times their original length.stress of 60 Pa.
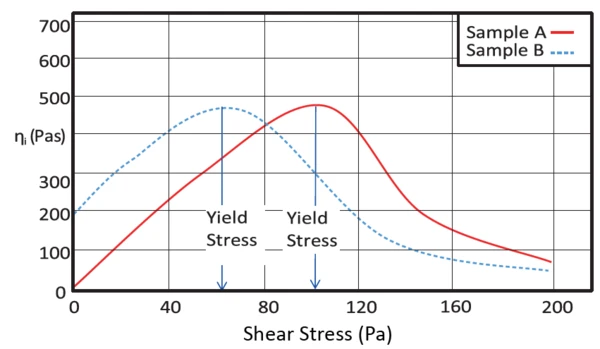
Table 1: Test conditions
| Samples | Topical cream |
| Geometry | Cone or parallel plate system 40 mm with a solvent trap |
| Temperature | 25°C |
Sequence used: Toolkit_V003 Yield StressStress is defined as a level of force applied on a sample with a well-defined cross section. (Stress = force/area). Samples having a circular or rectangular cross section can be compressed or stretched. Elastic materials like rubber can be stretched up to 5 to 10 times their original length.Stress (StressStress is defined as a level of force applied on a sample with a well-defined cross section. (Stress = force/area). Samples having a circular or rectangular cross section can be compressed or stretched. Elastic materials like rubber can be stretched up to 5 to 10 times their original length.Stress Ramp) | 1 - 200 Pa, up linear scaling |
| Ramp time | 30 seconds |
Topical Creams are a mixture of oil and water for the base. They are created using two different processes but with the same ingredients. One way is called the oil-in-water emulsion, and the other is called the water-in-oil emulsion. They are used to apply steroids, moisturizers, and antibiotics, e.g., hydrocortisone, and can heal certain skin conditions, like eczema, psoriasis, and dermatitis. Furthermore, they can aid in eliminating yeast infections and replace hormones.
https://burtsrx.com/topical-creams-uses-treatments-dosage
Conclusion Yield Stress
The Yield StressYield stress is defined as the stress below which no flow occurs; literally behaves like a weak solid at rest and a liquid when yielded.yield stress of the sample shows how it will behave while at rest. As these measurements are usually logarithmic in magnitude, It is important not to expect too close an agreement in the Yield StressYield stress is defined as the stress below which no flow occurs; literally behaves like a weak solid at rest and a liquid when yielded.yield stress values of the new drug and the OID formulations.
A2) Overcoming ‘Slippage’ When Characterizing Concentrated Suspensions
Introduction
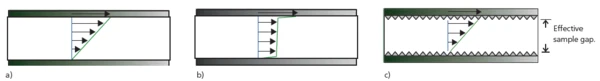
A common problem when measuring concentrated suspensions, such as topical creams, as shown here, is that instead of shearing in the normal laminar way, the sample starts to slip. Slip can occur at both the upper and lower surfaces, as shown in Figure 2.
The slip is either due to the material undergoing a local stress induced phase change or the liquid phase separating from the bulk of the sample to form a slip plane. By using roughened or serrated measuring systems, we can reduce and often completely eliminate slip. The serrations allow the stress to be applied over a larger area of sample and provide voids to accommodate any separating liquids.
Interpretation
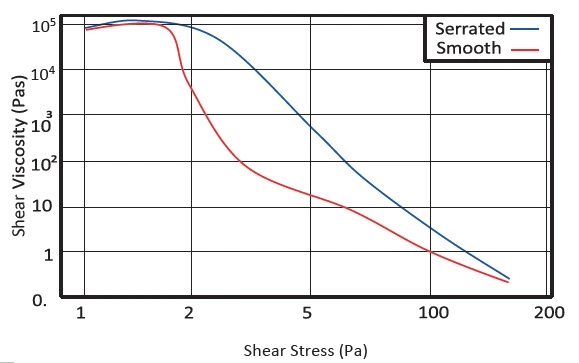
The flow properties of the sample are first measured using a regular parallel plate measuring system. The resulting curve, see Figure 3, shows a ‘double knee’ (two individual drops in the red viscosity curve), indicative of sample slippage. This is because the sample undergoes some separation under shear and the continuous phase is causing a lower viscosity region near the plate surfaces allowing it to slip rather than flow in a laminar way. Rerunning the sample with serrated plates, allows the separated continuous phase material to be accommodated in the grooves without allowing the sample to slip. The viscosity curve no longer contains the double knee and a more conventional Shear ThinningThe most common type of non-Newtonian behavior is shear thinning or pseudoplastic flow, where the fluid viscosity decreases with increasing shear.shear thinning profile is produced.
The stationary plane surface is now the peaks of the serrations for gap setting purposes as shown in figure c) above. If only the upper plate is serrated, then the slippage can easily continue at the lower plate instead, therefore both roughened or serrated upper and lower plates should be used.
Conclusion Slippage
Slippage can occur in concentrated particulate suspensions and materials susceptible to shear induced melting. When slip is suspected, a roughened or serrated measuring system should be used to test the sample. If the results from both the roughened and smooth plates were identical, no slippage would be occurring.
B) Measuring the Viscosity Flow Characteristics
Introduction
Topical creams are generally formulated to have a high viscosity at low shears and a low viscosity at high shears. A slightly higher viscosity at low shears gives the cream a good storage stability and is aesthetically pleasant, while, if the lotion has a low viscosity when at rest, it may be unstable with storage, giving separation. A low viscosity at high shear rates allows the product to be absorbed more quickly into the skin when rubbed whereas a product with a higher viscosity here may act as a barrier cream as it will leave a thicker coating.
Interpretation
The conditions of the results shown in Figure 4 are listed in Table 2. Figure 4 results show that sample A has a very high viscosity at low rates, indicating that it’s a firm, wellbodied product. However, its viscosity dropped dramatically at higher rates to become a thin liquid. Sample A would therefore probably be absorbed into the skin easily as well, making it an ideal drug delivery vehicle cream.
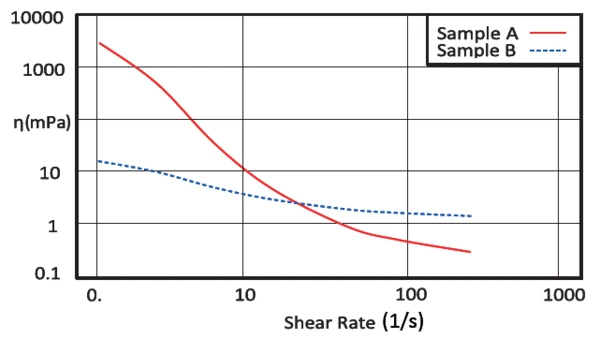
Table 2: Test conditions
| Geometry | Cone or parallel plate system 40 mm with a solvent trap |
| Gap | 500 μm or cone gap |
| Temperature | 27°C (~ body surface temperature) |
Used sequence: Toolkit_V001 Shear Rate Table | 0.1 - 200 1/s, up, logarithmic scaling, with Power law model fit |
Conclusion Viscosity Flow
Sample B’s viscosity at low shear rates was insufficiently high to give it good storage stability properties. Similarly, its high shear viscosity may not be low enough to allow it to absorb into the skin well.
C) Determining Visco-Elastic Properties
C1) Gelation Strength Determination
Introduction
In this test, both samples are subjected to a sinusoidally increasing stress. While the sample’s structure is maintained, the Complex ModulusThe complex modulus consists of two components, the storage and the loss moduli. The storage modulus (or Young’s modulus) describes the stiffness and the loss modulus describes the damping (or viscoelastic) behavior of the corresponding sample using the method of Dynamic Mechanical Analysis (DMA). complex modulus G* − a measure of the stiffness, remains constant. However, when the cream’s intermolecular forces are overcome by the oscillation stress, the sample breaks down and the modulus drops.
Interpretation
The test conditions for the results displayed in Figure 5 are given in Table 3. In Figure 5, topical cream sample B gave a much shorter Linear Viscoelastic Region (LVER)In the LVER, applied stresses are insufficient to cause structural breakdown (yielding) of the structure and hence important micro-structural properties are being measured.linear viscoelastic region than sample A and will therefore break down much more easily with vibrations and small movements. The length of the Linear Viscoelastic Region (LVER)In the LVER, applied stresses are insufficient to cause structural breakdown (yielding) of the structure and hence important micro-structural properties are being measured.linear viscoelastic region is also a good indication of the stability of the gel to resist sedimentation.
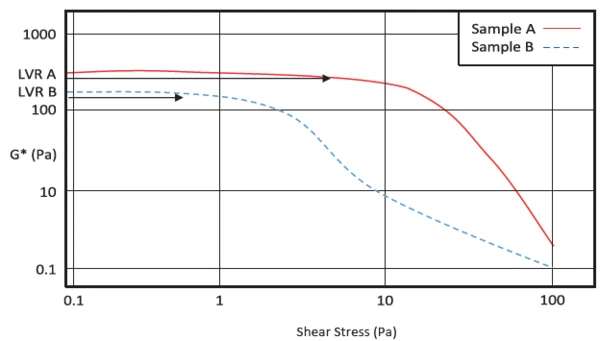
Table 3: Test conditions
| Samples | Wound healing gels, topical gels, etc. |
| Geometry | Cone or parallel plate system 40 mm with a solvent trap |
| Temperature | 25°C |
Oscillation_0006_Amplitude frequency seep with cross over.rseq | 0.1 - 100 Pa, up, logarithmic scaling |
Conclusion Gelation Strength
A relatively quick amplitude sweep experiment can indicate the strength of a gel and its modulus. This can therefore be used to optimize dosing of gelation agents and other components.
C2) Characterizing Gels and Creams Using Oscillation Frequency Sweeps
Introduction
A frequency sweep in the sample’s Linear Viscoelastic Region (LVER)In the LVER, applied stresses are insufficient to cause structural breakdown (yielding) of the structure and hence important micro-structural properties are being measured.linear viscoelastic region (LVR) can be used to characterize the viscoelastic properties of a gel, cream or solution. Where a material has strong particle-particle or droplet-droplet repulsions, such as sample A, it will show a gel like structure, and the Elastic modulusThe complex modulus (elastic component), storage modulus, or G’, is the “real” part of the samples the overall complex modulus. This elastic component indicates the solid like, or in phase, response of the sample being measurement. elastic modulus (G’) is dominant over the Viscous modulusThe complex modulus (viscous component), loss modulus, or G’’, is the “imaginary” part of the samples the overall complex modulus. This viscous component indicates the liquid like, or out of phase, response of the sample being measurement. viscous modulus (G”). This type of repulsively stable system is characterized by little change in the viscoelastic properties with frequency, as shown for sample A.
For materials that are stabilized by addition of a gel additive, it can be that too much additive causes the material to undergo syneresis, where the liquid phase is exuded from the bulk of the gel over time. In this case a slightly weaker structure is preferable.
Interpretation
The test conditions of the results shown in Figure 6 are summarized in Table 4. In a viscous material such as sample B, the Viscous modulusThe complex modulus (viscous component), loss modulus, or G’’, is the “imaginary” part of the samples the overall complex modulus. This viscous component indicates the liquid like, or out of phase, response of the sample being measurement. viscous modulus (G”, blue) is dominant over the Elastic modulusThe complex modulus (elastic component), storage modulus, or G’, is the “real” part of the samples the overall complex modulus. This elastic component indicates the solid like, or in phase, response of the sample being measurement. elastic modulus (G’, red), and both show frequency dependence. It is also possible to get a reversible network, which gives elastic properties at one extreme of frequency and viscous at the other. If a material is required to give good storage stability, it will generally need to be elastically dominated at low frequencies.
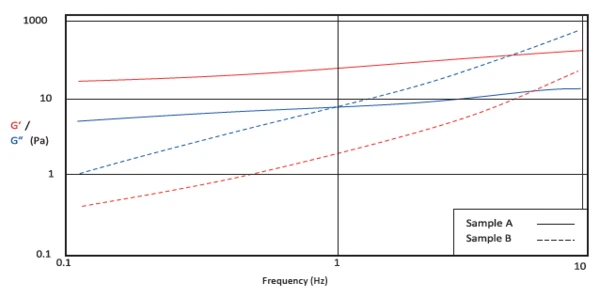
Table 4: Test conditions
| Samples | Gels or creams |
| Geometry | Cone or parallel plate system 40 mm with a solvent trap |
| Frequency sweep | 10 - 0.1 Hz |
Oscillation_0006 Amplitude frequency sweep with cross over.rse | 0.010 (or in LVR as found from amplitude sweep experiment before) |
Syneresis is the extraction or expulsion of a liquid from a gel without the gel structure collapsing as a result. This deswelling occurs during prolonged standing (aging) of gels, between whose phases (gel former and fluid) a high interfacial tension prevails. The densification of the individual phases reduces the interfacial area (example: the collection of whey on the surface of yogurt).
Conclusion Oscillation Frequency Sweep
A relatively quick frequency sweep experiment can indicate the strength of a gel, its modulus and its processing characteristics. This data can therefore be used to determine suitable gelation agents and optimize formulations.
C3) Characterizing Temperature Dependence
Introduction
The viscosity of topical creams can change significantly with temperature. Assessing the long-term stability of a pharmaceutical and personal care product by traditional methods can be tedious and time consuming, however, use of a rheometer makes this much simpler. When designing the test, we must account for the environmental conditions that the product is likely to encounter during its lifetime, i.e., possibly below freezing to as high as 50°C when being transported. Under such conditions, products may deteriorate and become visually unacceptable and/or less effective.
Interpretation
Table 5 shows the measurement conditions for the experiment results displayed in Figure 7. In order to determine the temperature stability of such products it is necessary to monitor the rheological behavior of the product through a number of temperature cycles. This is best assessed by monitoring the Complex ModulusThe complex modulus consists of two components, the storage and the loss moduli. The storage modulus (or Young’s modulus) describes the stiffness and the loss modulus describes the damping (or viscoelastic) behavior of the corresponding sample using the method of Dynamic Mechanical Analysis (DMA). complex modulus (G*) as a function of temperature. A thermally stable system should show similar cycling behavior since the microstructure should not have changed. For thermally unstable samples, temperature cycling will cause the Complex ModulusThe complex modulus consists of two components, the storage and the loss moduli. The storage modulus (or Young’s modulus) describes the stiffness and the loss modulus describes the damping (or viscoelastic) behavior of the corresponding sample using the method of Dynamic Mechanical Analysis (DMA). complex modulus to have a different temperature dependence on each thermal cycle.
Table 5: Test conditions
| Samples | Topical creams and gel samples |
| Geometry | Cone or parallel plate system 40 mm with a solvent trap |
| Pre-test amplitude sweep | StrainStrain describes a deformation of a material, which is loaded mechanically by an external force or stress. Rubber compounds show creep properties, if a static load is applied.Strain 0.01% to 100%, up, logarithmic scaling, 7 points per decade points in a row. A StrainStrain describes a deformation of a material, which is loaded mechanically by an external force or stress. Rubber compounds show creep properties, if a static load is applied.strain in the LVR is then taken for the oscillation temperature ramp test. |
| Temperature | 10 to 50°C (temperature ramp up and down) at 3°C/minute |
Use sequence: rSolution_0018 Evaluating temperature cycling.rseq | StrainStrain describes a deformation of a material, which is loaded mechanically by an external force or stress. Rubber compounds show creep properties, if a static load is applied.Strain: 0.005 (or as derived from amplitude sweep above), Frequency: 1 Hz, Delay time: 1 second, Wait time: 0 seconds |
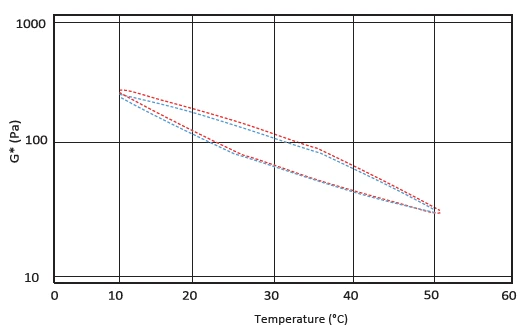
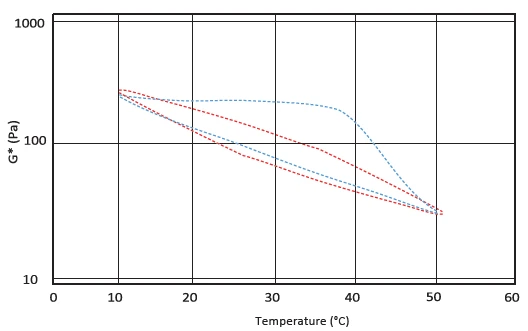
Conclusion Temperature Dependence
This test shows methodology and data for Thermal StabilityA material is thermally stable if it does not decompose under the influence of temperature. One way to determine the thermal stability of a substance is to use a TGA (thermogravimetric analyzer). thermal stability for two topical cream formulations.
Summary
A series of three tests on the Kinexus rotational rheometer can be used to automatically characterize all four of the FDA requirements for a topical cream sample. Furthermore, if the tests are conducted starting with the least destructive and finishing with the most destructive, they can all be done with one loading of a sample with no user involvement between the loading and clean-up steps. This would be first the Amplitude Sweep and Frequency Sweep Tests, followed by the Yield StressStress is defined as a level of force applied on a sample with a well-defined cross section. (Stress = force/area). Samples having a circular or rectangular cross section can be compressed or stretched. Elastic materials like rubber can be stretched up to 5 to 10 times their original length.Stress and Viscometry Flow Curve tests. Using a Kinexus rheometer, you can use the following sequences:
1) Oscillation_0006 Amplitude sweep with LVR plus StrainStrain describes a deformation of a material, which is loaded mechanically by an external force or stress. Rubber compounds show creep properties, if a static load is applied.strain frequency sweep withCross over pointIn rheological test such as a frequency sweep or a time/temperature sweep, the cross over point is a convenient point of reference to indicate a “transition” point of the sample. cross over.rseq
2) Toolkit_V003 Yield StressStress is defined as a level of force applied on a sample with a well-defined cross section. (Stress = force/area). Samples having a circular or rectangular cross section can be compressed or stretched. Elastic materials like rubber can be stretched up to 5 to 10 times their original length.Stress (StressStress is defined as a level of force applied on a sample with a well-defined cross section. (Stress = force/area). Samples having a circular or rectangular cross section can be compressed or stretched. Elastic materials like rubber can be stretched up to 5 to 10 times their original length.Stress Ramp)
3) Toolkit_V001 Shear Rate Table
The oscillation Amplitude Sweep test in step 1 – C1) is designed to automatically stop when the StrainStrain describes a deformation of a material, which is loaded mechanically by an external force or stress. Rubber compounds show creep properties, if a static load is applied.strain just slightly exceeds the LVR of the sample and the modulus drops by >1% for 5 consecutive points. This prevents it from breaking the sample significantly and is certainly less strenuous to the material than reloading a new sample.
Final Thoughts
Sampling and Reproducibility
As with any testing, the results obtained are only as good as the sample used, and so sampling must be representative of the bulk of the test material. It is therefore preferable to sample at three or more places in the lot to ensure that the samples represent the whole. It is also normal to conduct a reproducibility test on at least one of the samples three (or more) times to establish the statistical accuracy of the technique and test results.
Setting of Quality Control Specification Parameters
While it’s common for a QC test in some other analysis area to have a pass/fail specification of ±10% or so, it should be noted that with rheology most of the material properties have logarith-mic relationships. Therefore, it may be surprising to hear that rather than whole milk having a 20% higher viscosity than water (for instance) it is closer to 400% of the viscosity of water. Similarly, it is difficult to discern differences between two creams manually if a cream is less than twice the viscosity of another. Therefore it should be strongly discouraged to set an arbitrarily tight specifications for quality control.
The NETZSCH Kinexus rheometer may be used to accurately characterize properties of topical creams with accuracy, reproducibility and minimal user involvement. This robust technique can therefore be used to optimize current formulations and create new products in accordance with the FDA regulations for ANDA submissions.