Introduction
A powder is generally seen as a material composed of particles. However, it contains air (between the particles), as well as moisture, because the particles may absorb water if they are stored in a humid atmosphere. Those three components (particles, air and water) influence the processing of powders. For example, very fine particles with a high affinity for water may cake during production, storage, or transport, influencing the powder flowability, and thus leading to longer processing times.
Experimental
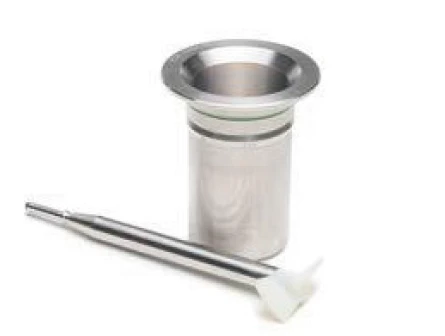
The Kinexus rotational rheometer compares the flowability of different powders in fast and easy-to-run measurements, using the Freeman method [1]. For that, a cup and a 2-blade upper geometry are used (figure 1). The temperature control is ensured by the cylinder cartridge, in which the lower geometry (cup) is introduced. Because the results are very dependent on the powder conditioning, it is crucial to prepare the different samples on exactly the same conditions: Same sample amount, same pre-conditioning parameters (e.g., a defined speed and time of rotation).
Measurement Conditions
In the following method, the flowability of two different lubricant powders (labelled as 1 and 2) are compared. During the measurements, the 2-blade paddle descends at a defined speed into the cup containing the sample until it is completely immersed in the powder, and then the paddle ascends, returning to its starting position. A controlled rotational speed is applied additionally to the axial speed. Table 1 summarizes the conditions of the tests.
Table 1: Measurement conditions
| Device | Kinexus ultra+, cylinder cartridge |
|---|---|
| Upper geometry | Stirrer with interchangeable 2-blade system |
| Lower geometry | Cup made of aluminum, 37 mm diameter |
| Axial speed | 1 mm∙s-1 (DOWN), -1 mm∙s-1 (UP) |
| Rotational speed | 5 rad∙s-1 |
| Gap | 70 mm to 35 mm (DOWN), 35 mm to 70 mm (UP) |
Measurement Results
The torque and the normal force required for the 2-blade paddle to rotate and to travel into the powder at controlled rotational and axial speeds were recorded.
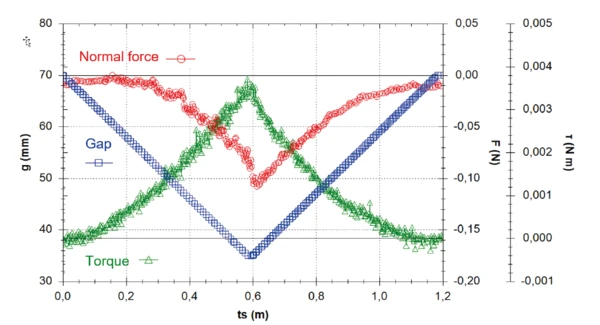
Figure 2 displays the result of the measurement performed on lubricant 1. The further the paddle is immersed into the powder (test DOWN), the more torque it requires to maintain a constant rotational speed. During the run down of the paddle from 70 to 35 mm, the torque increases from 0 to 4 mN.m. The normal force doesn´t begin to decrease until the paddle has travelled almost the half of the path. It reduces by 100 mN during the test DOWN.
As soon as the paddle moves upward, both signals behave in a symmetrical way: The torque decreases again, while the normal force increases, both signals reaching the value of 0 at the end of the measurement (because the paddle is outside of the powder and rotates in the air).
Both torque and normal force signals are related to the resistance of the powder to flow. The deeper the paddle is immersed into the sample, the more resistance the powder offers to the axial and rotational movements of the geometry.
It should be noted that the measurement takes little more than one minute to be performed in both downwards and upwards directions (roundtrip time).
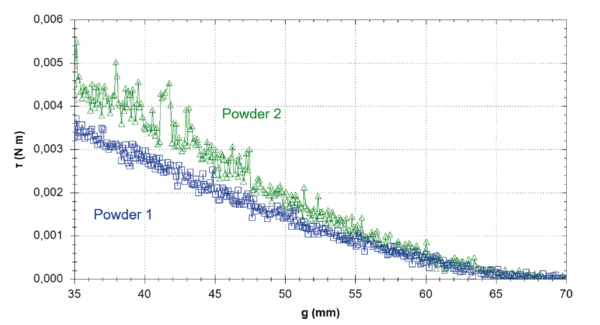
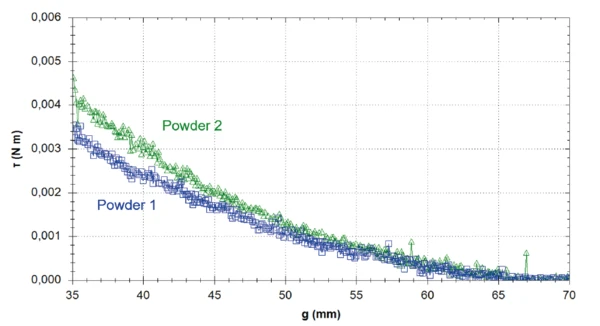
Figures 3 and 4 compare the torque of both products while the paddle is going downwards into the powder (figure 3) and upwards (figure 4). In both test directions, a higher torque is required in powder 2 to maintain a constant rotational speed, i.e. this powder shows a higher resistance to flow and thus a lower flowability. Moreover, the signal of this sample is noisier.
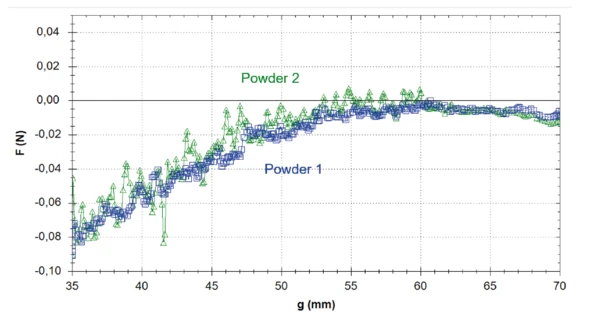
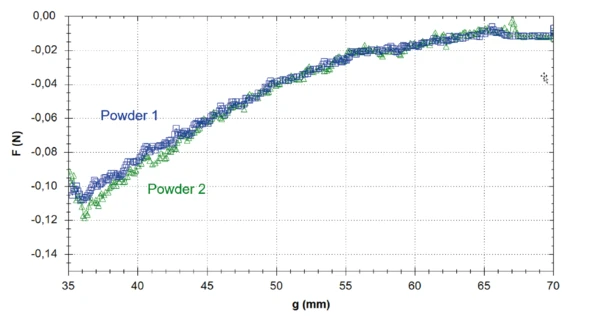
Figures 5 and 6 display the normal force of both powders during the test DOWN (figure 5) and UP (figure 6). Although the curves are very similar between both materials, they differ in the noise: For both test directions, the normal force is noisier for powder 2, similarly as for the torque signals.
Automated microscopy images performed on both powders (figure 7) can be related to their rheological behavior: Powder 2 contains bigger particles than powder 1 and has therefore a reduced ability to flow. The curves of the volume distribution for both samples presented in Figure 8 as well as their particle size volume distribution Dv10, Dv50 and Dv90 shown in Table 2 confirm this visual result.

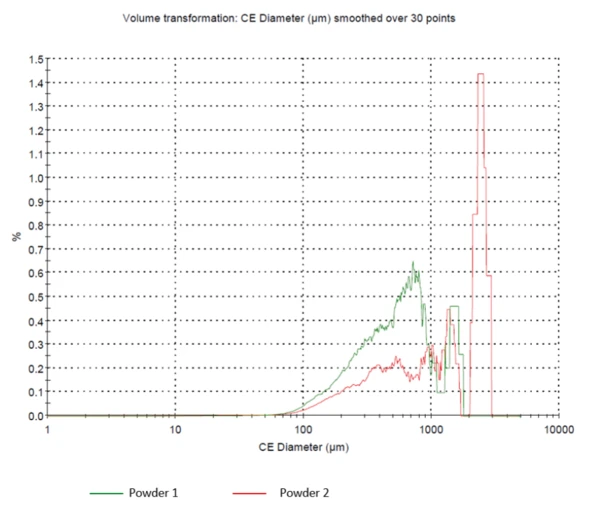
Table 2: Particle size volume distribution of the tow 2 lubricant powders
| D(v,0.1) [μm] | D(v,0.5) [μm] | D(v,0.9) [μm] | |
|---|---|---|---|
| Powder 1 | 199.2 | 570.5 | 1436.6 |
| Powder 2 | 256.0 | 1348.9 | 2582.2 |
Conclusion
The flowability of two lubricant powders was compared by applying the Freeman method on the Kinexus rotational rheometer. For this method, a paddle was immersed at a defined axial and rotational speed into a cup filled with the sample. Differences were detected in the curves of the torque required to maintain a constant paddle speed. A higher torque is related to a higher resistance to flow, i.e., a reduced flowability. The particle size volume distribution of the powders correlated the results: The product containing larger particles was the one with the lower flowability.
Such tests are very fast and can be interpreted at one glance by a curve comparison.