Introduction
Extrusion, injection molding and compression molding are all processes reliant upon a material’s viscosity, i.e., its resistance to flow. However, viscosity not only influences the processing, but also the mechanical characteristics of the final product. In particular, molecular mass and viscosity are closely connected.
In the following, three different PEEK materials are classified according to their molecular mass using oscillation measurements on a Kinexus rotational rheometer.
Measurement Conditions
Frequency measurements were performed on three materials, designated PEEK 1, PEEK 2 and PEEK 3. The StrainStrain describes a deformation of a material, which is loaded mechanically by an external force or stress. Rubber compounds show creep properties, if a static load is applied.strain (or StressStress is defined as a level of force applied on a sample with a well-defined cross section. (Stress = force/area). Samples having a circular or rectangular cross section can be compressed or stretched. Elastic materials like rubber can be stretched up to 5 to 10 times their original length.stress) applied to the sample must be low enough to not destroy the sample’s structure so that the measurement is performed within the linear-viscoelastic range (Linear Viscoelastic Region (LVER)In the LVER, applied stresses are insufficient to cause structural breakdown (yielding) of the structure and hence important micro-structural properties are being measured.LVER). An amplitude sweep serves as a preliminary measurement to determine the Linear Viscoelastic Region (LVER)In the LVER, applied stresses are insufficient to cause structural breakdown (yielding) of the structure and hence important micro-structural properties are being measured.LVER limit. Table 1 depicts the conditions of the amplitude and of the frequency sweeps.
Table 1: Conditions of the oscillation measurements
| Amplitude Sweep | Frequency Sweep | |
|---|---|---|
| Device | Kinexus ultra+ with electrically heated chamber | |
| Geometry | PP25 (plate-plate, diameter: 25 mm) | |
| Gap | 500 μm | 500 μm |
| Temperature | 360°C | 360°C |
| Shear StrainStrain describes a deformation of a material, which is loaded mechanically by an external force or stress. Rubber compounds show creep properties, if a static load is applied.strain | 1 to 100% | - |
| Shear StressStress is defined as a level of force applied on a sample with a well-defined cross section. (Stress = force/area). Samples having a circular or rectangular cross section can be compressed or stretched. Elastic materials like rubber can be stretched up to 5 to 10 times their original length.stress | - | 1,000 Pa (PEEK 1), 500 Pa (PEEK 2 and 3) |
| Frequency | 1 Hz | 10 to 0.01 Hz |
| Atmosphere | Nitrogen (1 l/min) | |
Amplitude Sweep: Determination of the LVER (Linear Visco-Elastic Range)
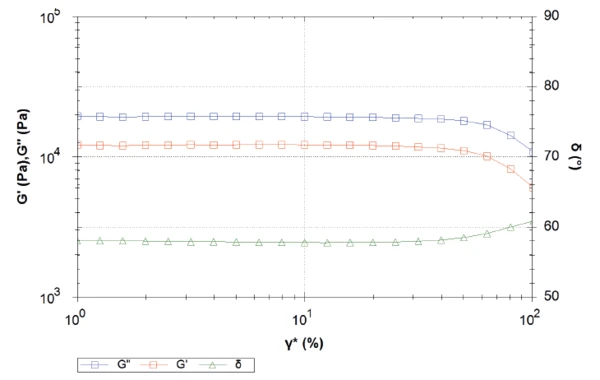
Figure 1 depicts the curves resulting from the amplitude sweep on PEEK 1 as a function of shear StrainStrain describes a deformation of a material, which is loaded mechanically by an external force or stress. Rubber compounds show creep properties, if a static load is applied.strain. For shear strains up to approx. 30% – corresponding to a shear StressStress is defined as a level of force applied on a sample with a well-defined cross section. (Stress = force/area). Samples having a circular or rectangular cross section can be compressed or stretched. Elastic materials like rubber can be stretched up to 5 to 10 times their original length.stress of approx. 10,000 Pa – the elastic shear modulus G´ remains constant, suggesting that the material is located in Linear Viscoelastic Region (LVER)In the LVER, applied stresses are insufficient to cause structural breakdown (yielding) of the structure and hence important micro-structural properties are being measured.LVER. The decrease in G´ for higher shear strains is due to the breakdown of the sample’s structure. For the following frequency sweep, a shear StressStress is defined as a level of force applied on a sample with a well-defined cross section. (Stress = force/area). Samples having a circular or rectangular cross section can be compressed or stretched. Elastic materials like rubber can be stretched up to 5 to 10 times their original length.stress of 1,000 Pa is selected.
Frequency Sweep
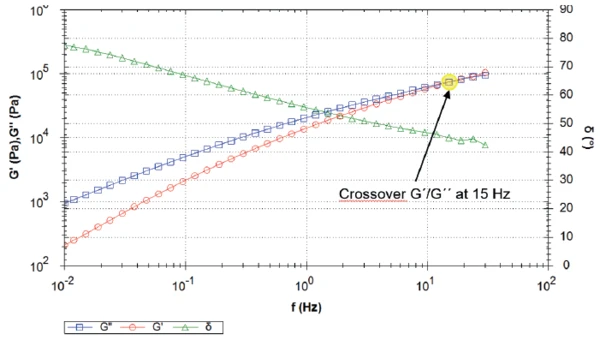
Figure 2 depicts the curves of elastic and loss shear moduli in addition to the phase angle during a frequency sweep of PEEK material 1. In direction of the lower frequencies, loss shear modulus dominates elastic shear modulus, resulting in a phase angle higher than 45°C. The G’ and G” curves crossover at a frequency of 15 Hz. Here, the material transitions from a liquid-dominated state, in which the polymer chains have time to disentangle (low frequencies), to a solid-dominated state, where the chains are interlocked and behave like a network (high frequencies).
Some Definitions
G*: Complex shear modulus
G': Storage shear modulus, elastic contribution to G*
G": Loss shear modulus, viscous contribution to G*
δ: Phase angle
The phase angle δ (δ = G“/G‘) is a relative measure of the viscous and elastic properties of a material. If ranges from 0° for a fully elastic material to 90° for a fully viscous material.
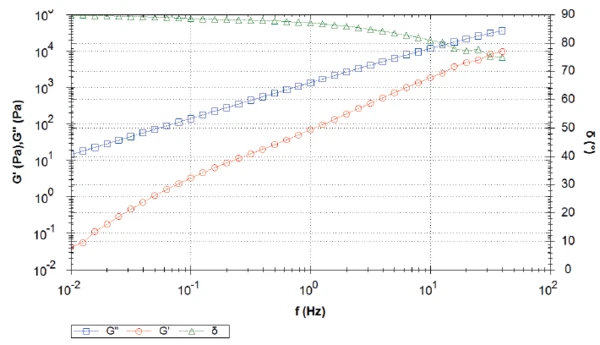
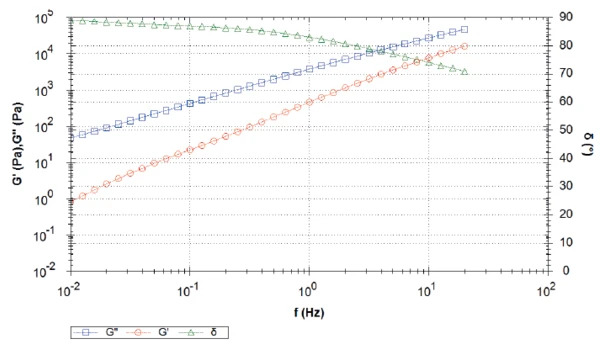
Figures 3 and 4 display the frequency sweep of PEEK samples 2 and 3 under the same conditions. The resulting curves of both materials are very similar and differ from the first sample. During the complete measurement, the viscous shear modulus (G”) dominates the elastic shear modulus (G’), resulting in a phase angle (δ) higher than 45°. In direction of the lower frequencies, the phase angle increases to reach almost its maximum value of 90°. In other words, at low frequencies (or longtime scales), the sample behaves like an almost purely viscous fluid without any elastic properties. No crossover was detected in the measured frequency range, however, it likely exists at higher frequencies because the G´ and G” curves tend towards each other with increasing frequencies. The molecular mass of the polymers is related to the position of the crossover: The lower the frequency of the crossover, the higher the molecular mass.
In this case, PEEK 1 has a higher molecular mass than PEEK 2 and PEEK 3. PEEK 2 and PEEK 3 differ in the values of the elastic shear modulus. It is lower for PEEK 2 than for PEEK 3 in the entire frequency range measured (more than one decade difference at 0.01 Hz). The loss shear modulus of PEEK 2 is also lower than PEEK 3. This results in a higher stiffness for PEEK 3.
From the Zero Shear Viscosity Plateau to the Molecular Mass
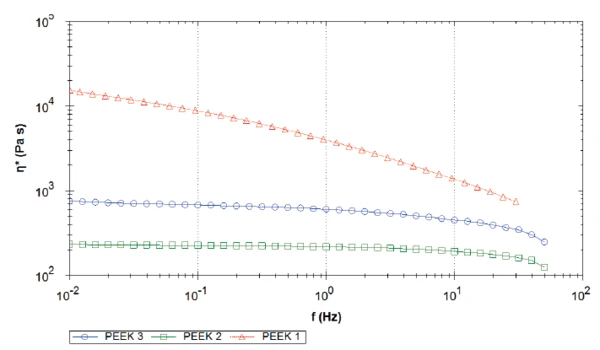
Figure 5 compares the complex viscosity (η) of all three samples. The curves of PEEK 1 and PEEK 2 are almost parallel, both reach a Newtonian plateau in the lowfrequency range and show a Shear ThinningThe most common type of non-Newtonian behavior is shear thinning or pseudoplastic flow, where the fluid viscosity decreases with increasing shear.shear-thinning behavior at higher frequencies. The level of the Newtonian plateau is related to the molecular mass of the polymer: The higher the molecular mass, the higher the zero viscosity. [1]
In contrast, the complex viscosity (η*) of sample 1 continues to increase with decreasing frequencies and the Newtonian plateau is still not reached at a frequency of 0.01 Hz. Moreover, for the complete frequency range measured, this PEEK material shows higher complex viscosity with more than 1.5 decades difference to sample 2 at 0.01 Hz.
From the level of shear viscosity plateau of all three samples, it can be concluded that PEEK 1 has a higher molecular mass, followed by PEEK 2 and PEEK 3. This confirms the results obtained by the G´ and G” curves.
Conclusion
The rheological behavior of three PEEK samples were characterized using the Kinexus rotational rheometer. They differ in the value of the zero-shear viscosity plateau of the complex viscosity. This is due to differences in the molecular masses of the materials.