24.02.2020 by Milena Riedl
Простой способ оценки и управления данными о материалах
Знание тепловых свойств материала имеет решающее значение для производства деталей из термопластов. Однако материалы не всегда поставляются с достаточной информацией обо всех свойствах. Приборы для термического анализа позволяют самостоятельно определить наиболее важные параметры. Но прибор - это только первый шаг. Программное обеспечение не менее важно. Вот два примера того, как Proteus® может помочь получить более быстрые результаты.
Знание тепловых свойств материала имеет решающее значение для производства термопластичных деталей и компонентов без дополнительных затрат на производство брака. Одновременно данные о материале важны для создания симуляторов формования, обеспечивающих успешное производство. Однако не всегда материалы поставляются с достаточной информацией обо всех свойствах - причем бесплатно. Для того чтобы самостоятельно выяснить наиболее важные параметры, вам подойдут приборы термического анализа. Например, дифференциальная сканирующая калориметрия - простой в использовании и точный метод определения критериев качества сырья, таких как температура стеклования и пик плавления. Но прибор - это только первый шаг. Программное обеспечение, которое оценивает результаты измерений, не менее важно, чтобы обеспечить плавный и быстрый процесс, сократить расходы и позволить специалистам сосредоточить свое внимание на более сложных измерениях. Программное обеспечениеProteus®программное обеспечение, встроенное в приборы для термического анализа NETZSCH, обладает полезными функциями для оценки и управления данными о материалах. Вот два примера.
Легко оценивайте результаты измерений с помощью искусственного интеллекта
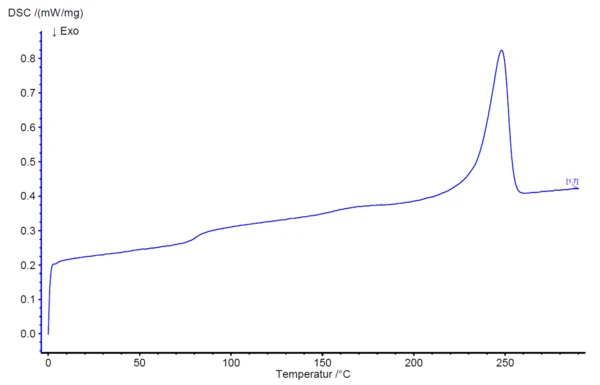
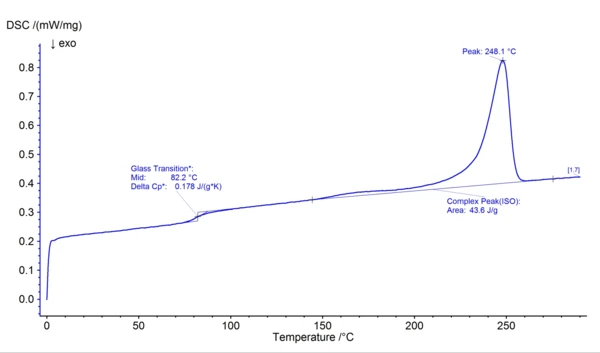
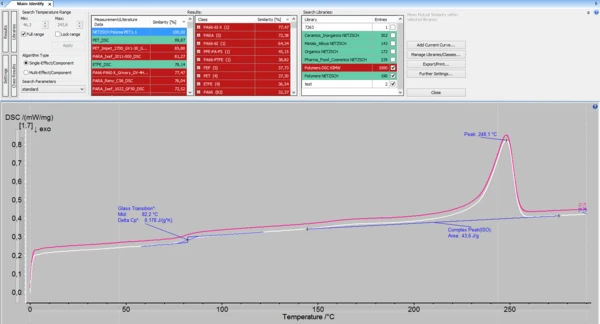
На рис. 1 показан фрагмент температурной программы для образца полимера, измеренного с помощью ДСК 214.Polyma. Ручная оценка результатов занимает много времени и подвержена ошибкам, так как иногда эффекты трудно определить и они видны только опытному глазу.AutoEvaluationфункция вProteus®программное обеспечение может помочь получить более быстрые результаты или выступить в качестве второго мнения. Уникальная процедура оценки автономно находит и оценивает все эффекты на кривых ДСК и ТГА с помощью интеллектуального математического алгоритма. На рисунке 2 показано, как выглядит измерение на рисунке 1.AutoEvaluationрезультаты измерения на рисунке 1. Программное обеспечение автономно определило стеклование, площадь сложного пика и пик плавления анализируемого материала.
Идентифицировать и классифицировать материал в течение нескольких секунд
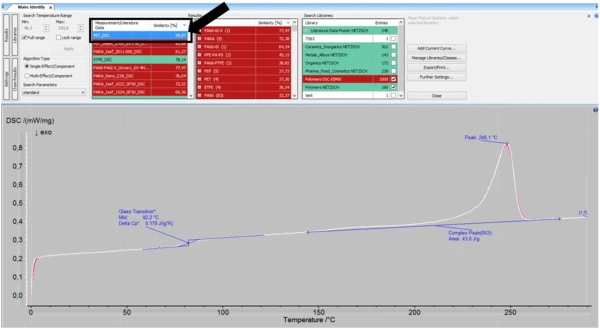
На сайтеProteus®программное обеспечение предлагает еще больше возможностей. Функция Identify позволяет идентифицировать и классифицировать материалы в течение нескольких секунд. Одним щелчком мыши экспериментальные кривые можно проверить на совпадение с сохраненными индивидуальными кривыми, литературными данными и статистическими классами. При использовании Identify для дальнейшего изучения приведенного выше измерения становится ясно, что сходство с 99,87 % анализируемый материал - это ПЭТ.
Сделайте еще один шаг вперед: Создайте свои собственные данные о материалах library
Предустановленный libraряд литературных данных, статистических классов и опционально 1000 различных коммерчески доступных полимеров - это не предел! Вы можете неограниченно расширять libraряд своими данными измерений. Такие libra-рии могут быть одновременно доступны нескольким другим пользователям в компьютерной сети. Как это сделать?
- Проведите измерения с материалом, который вы хотите добавить в library.
- Щелкните на своем измерении и select "Идентифицировать". Над измерением появится панель Identify .
- Нажмите на кнопку "Добавить текущую кривую..."
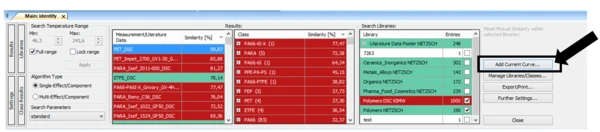
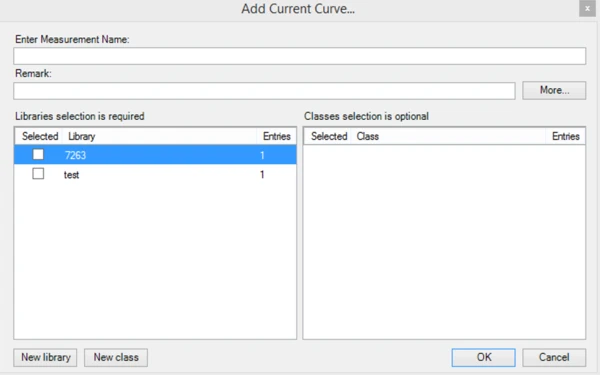
4. Назовите ваше измерение или материал и сделайте примечания (если необходимо). Select существующий library или добавьте новый library в следующем появившемся окне.
5. Поздравляем! Теперь материал успешно сохранен в базе данных! 6. В следующий раз, когда вы запустите анализ материала, select libra ry с вашими собственными измерениями (здесь: тест). Программа подскажет вам, какой эталонный материал в library наиболее похож на материал, измеренный в данный момент. В данном случае сходство материалов составляет 100 %, поскольку они имеют одинаковые измерения.
Это действительно так просто!
Имея собственную базу данных, вы можете легко контролировать качество сырья всего несколькими щелчками мыши. Узнайте больше о нашем программном обеспеченииProteus® здесь.