Introduction
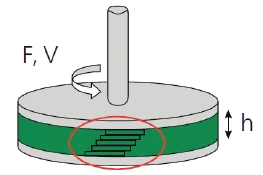
A viscometry measurement determines the shear viscosity of a material. In this type of test, a sample is placed between two plates. The upper plate rotates with a defined shear rate (or shear StressStress is defined as a level of force applied on a sample with a well-defined cross section. (Stress = force/area). Samples having a circular or rectangular cross section can be compressed or stretched. Elastic materials like rubber can be stretched up to 5 to 10 times their original length.stress), see Figure 1. The shear rate is determined using the angular speed V, of the upper plate as well as the distance h, between both plates. The shear StressStress is defined as a level of force applied on a sample with a well-defined cross section. (Stress = force/area). Samples having a circular or rectangular cross section can be compressed or stretched. Elastic materials like rubber can be stretched up to 5 to 10 times their original length.stress required to induce this shear rate is calculated using the torque applied, F.
Such a measurement can be carried out as shear rate controlled, as explained above, or as shear StressStress is defined as a level of force applied on a sample with a well-defined cross section. (Stress = force/area). Samples having a circular or rectangular cross section can be compressed or stretched. Elastic materials like rubber can be stretched up to 5 to 10 times their original length.stress controlled.
In this case, the shear StressStress is defined as a level of force applied on a sample with a well-defined cross section. (Stress = force/area). Samples having a circular or rectangular cross section can be compressed or stretched. Elastic materials like rubber can be stretched up to 5 to 10 times their original length.stress is applied and the shear rate is determined.
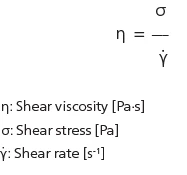
Independent of the control mode, the determination of shear viscosity is possible with the following formula:
The shear rate range of such a measurement is limited. If the centrifugal force (tending to move the material outwards) exceeds the normal force (that pushes the upper geometry upwards), the sample may be ejected out of the measurement gap. In this case, the resulting viscosity curve should be evaluated with great care. The shear StressStress is defined as a level of force applied on a sample with a well-defined cross section. (Stress = force/area). Samples having a circular or rectangular cross section can be compressed or stretched. Elastic materials like rubber can be stretched up to 5 to 10 times their original length.stress curve is one of the indicators showing its validity. Because it should always increase with increasing shear rates, a decrease in the shear StressStress is defined as a level of force applied on a sample with a well-defined cross section. (Stress = force/area). Samples having a circular or rectangular cross section can be compressed or stretched. Elastic materials like rubber can be stretched up to 5 to 10 times their original length.stress indicates the limit of the measurement range.
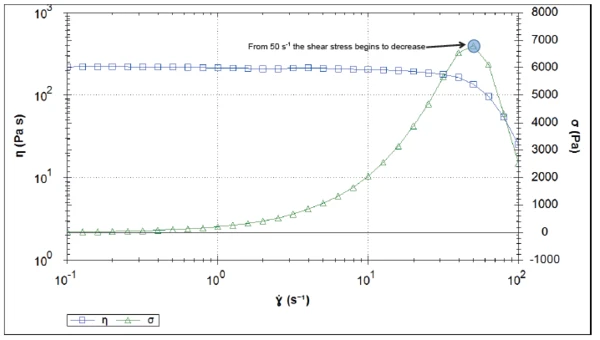
Figure 2 depicts an example of this behavior. Here, a polymer melt (PEEK) was measured in rotation between 0.1 and 100 s-1. The decrease of the shear StressStress is defined as a level of force applied on a sample with a well-defined cross section. (Stress = force/area). Samples having a circular or rectangular cross section can be compressed or stretched. Elastic materials like rubber can be stretched up to 5 to 10 times their original length.stress from 50 s-1 indicates sample ejection (also known as sample fracture) because the shear StressStress is defined as a level of force applied on a sample with a well-defined cross section. (Stress = force/area). Samples having a circular or rectangular cross section can be compressed or stretched. Elastic materials like rubber can be stretched up to 5 to 10 times their original length.stress starts to drop at this point. Therefore, the viscosity values above this shear rate are not valid and representative of the sample.
How to Obtain Shear Viscosity at Higher Shear Rates?
An easy way to obtain results at shear rates higher than 50 s-1 (in a rotational rheometer) is to use the Cox-Merz rule. This empirical relationship stipulates that for most unfilled polymer melts, the shear viscosity η can be predicted by the complex viscosity η*. An alternative solution for measuring flow behavior at faster processing conditions or higher shear rates can be achieved with the use of a high-pressure capillary rheometer.
What is Complex Viscosity?
The complex viscosity is obtained by an oscillation measurement. In this test, the upper geometry no longer rotates, but oscillates at a specified frequency (figure 3).
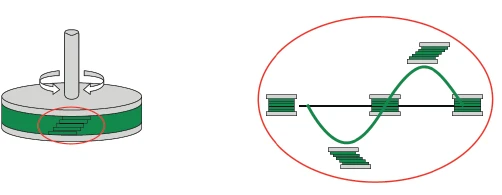
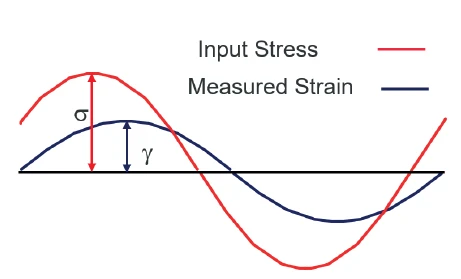
The difference (lag/phase δ) in the input and output sinusoidal signal defines the material properties of the sample (figure 4). These measurements are performed for amplitudes that are small enough not to destroy the sample's structure, so that applied StrainStrain describes a deformation of a material, which is loaded mechanically by an external force or stress. Rubber compounds show creep properties, if a static load is applied.strain and resultin StressStress is defined as a level of force applied on a sample with a well-defined cross section. (Stress = force/area). Samples having a circular or rectangular cross section can be compressed or stretched. Elastic materials like rubber can be stretched up to 5 to 10 times their original length.stress are proportional and the frequency of the response is equal to that of the input frequency.
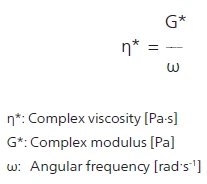
Through this type of test, the viscoelastic properties of the material are quantified, for example, its stiffness1 given by the so-called Complex ModulusThe complex modulus consists of two components, the storage and the loss moduli. The storage modulus (or Young’s modulus) describes the stiffness and the loss modulus describes the damping (or viscoelastic) behavior of the corresponding sample using the method of Dynamic Mechanical Analysis (DMA). complex modulus, G*. The complex viscosity, η*, is:
Complex Viscosity and Shear Viscosity: The Cox-Merz Rule
The Cox-Merz rule can be summarized by the following relationship:
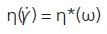
Expressed in words, this means that the shear viscosity result as a function of shear rate (obtained by rotation) is equivalent to the complex viscosity result as a function of angular frequency (obtained by oscillation). Therefore, it is possible to obtain the shear viscosity for shear rates higher than the limit of a rotational measurement, which was 50 s-1 for the example presented in this article.
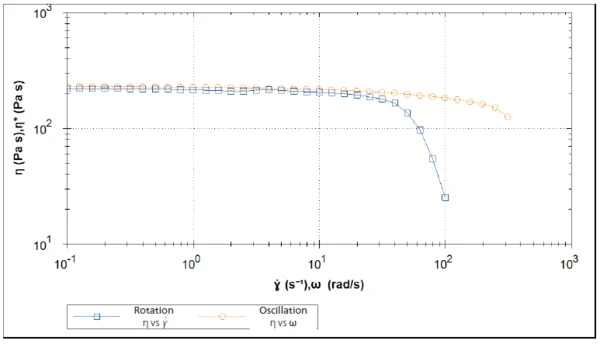
Figure 5 shows the results of both rotation and oscillation measurements for the PEEK sample plotted as a function of shear rate and angular frequency on the same scale. It is common that such curves will only be displayed as a function of shear rate with a remark to the Cox-Merz rule. The results presented in Figure 5 indicate that in the lower shear rate range, the complex viscosity and the shear viscosity are in good agreement. At higher shear rates, a more accurate value of the shear viscosity is obtained using the Cox-Merz rule on the complex viscosity (orange line). The more pronounced decrease in shear viscosity (blue line) is due to sample fracture, as explained above.
Conclusion
The example displayed shows a good agreement between the shear viscosity and complex viscosity in the low shear rate range. As soon as the material starts to flow out of the gap during rotation, the viscosity can no longer be determined by this type of measurement. The Cox-Merz rule, however, enables shear viscosity values to be determined using an oscillation measurement.