Introduction
Taste is only one of several factors important to the consumer when using ketchup and similar sauces. In addition to tangy or sweet flavoring, we also look at the rheological properties of a product – even if in an unconscious way. Do I have to squeeze my plastic bottle (or hit my glass bottle) very hard to induce flowing? Or, in contrast, does the sauce stream out even before I start applying pressure to the bottle, resulting in a red mess on my plate? Does the bottleneck remain clean after the application? Does the sauce stay on my plate exactly where I want it to, without spreading everywhere? Is there an unappetizing phase separation?
All these questions can be answered by rheological analysis. Here, we want to describe the flowing process of ketchup from the bottle to the plate.
Flow Depends on the Shear Rate
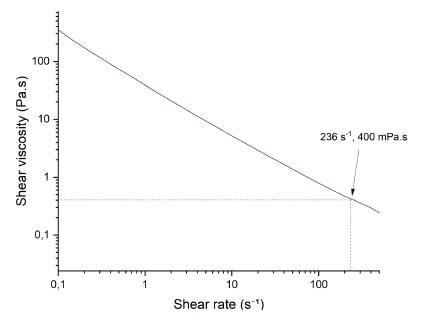
An example of a shear viscosity curve, measured on commercial ketchup, is presented in Figure 1. Ketchup shows shear-thinning behavior, meaning that the shear viscosity decreases with increasing shear rates. The higher the speed of the process, the lower the resistance to flow.
How to Calculate the Shear Rate of a Process?
For a ketchup bottle, it depends on the entire size and on the volumetric flow rate:
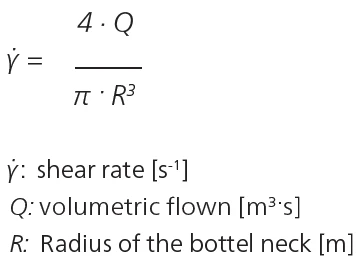
Assuming a neck radius of 3 mm and a volumetric flow rate of 5 ml/s, ketchup will reach a shear rate of 236 s-1. At this shear rate, the shear viscosity amounts to 400 mPa·s (see figure 1). The lower this value, the lower the resistance of ketchup as it is pressed out of the bottle. Use of a bottle with a larger neck size will reduce the shear rate involved during the process, and thus, the resistance to flow.
Ketchup Requires External Stress to Induce Flowing, Yield Stress
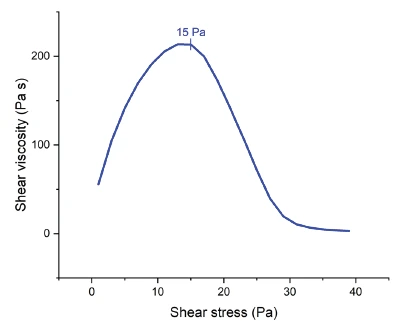
The ever-increasing viscosity as the shear rate approaches zero (figure 1) means that ketchup will not flow when at rest. It has a solid-like structure, which can be quantified with the yield stress. This is the stress required to induce flowing. A method of measuring it is to apply a shear-stress ramp on the material, as shown in figure 2. At low shear stresses, the resulting curve of the instantaneous viscosity increases as the sample’s structure is stretching. The curve maximum detected at 15 Pa is related to the yield stress. Any higher stress applied on ketchup leads to breakdown of the structure and thus to flowing. More information about yield stress is explained in Application Note 250.
Does the Flow Continue on the Plate?
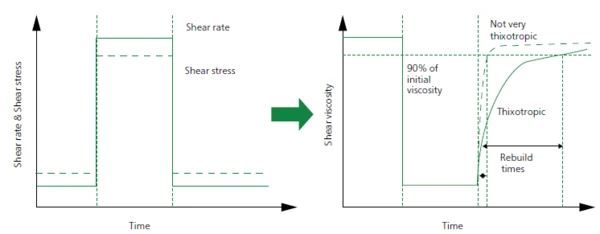
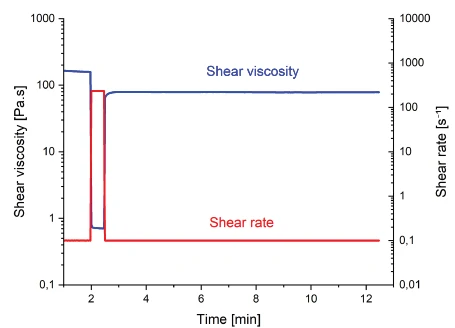
Another important property of ketchup is the structure recovery after flowing. A fast recovery is a condition for avoiding any unintentional spreading of the sauce on the plate. A ThixotropyUntuk sebagian besar cairan, penipisan geser dapat dibalik dan cairan pada suatu saat akan mendapatkan viskositas aslinya ketika gaya geser dihilangkan.thixotropy test quantifies the time needed to rebuild the structure after the flowing process. It can be measured with a three-step shear test, as depicted in figure 3:
- Phase 1 (at rest): Measurement of the shear viscosity at low shear rate (0.1 s-1), until the shear viscosity is stable.
- Phase 2 (under shear): Application of a higher shear rate to induce breakdown of the sample’s structure. For example, in a suspension under laminar flow, the particales arrange to layers. This leads to a decrease in shear viscosity.
- Phase 3 (recovery): The same shear rate is applied as in phase 1. Here, the time needed for the shear viscosity to return to the level observed in phase 1 is determined.
Such a thixotropic test on ketchup (figure 4) was also performed in practice. The shear-viscosity behavior at the beginning of the third phase shows whether, and how fast, the product recovers from the shearing force applied in the second phase. In our case, the fast increase in shear viscosity indicates fast rebuilding of the structure. However, even if the shear viscosity reaches a plateau very fast, there is a difference to the orignal shear viscoscosity, meaning that the structure has not entirely recovered.
Conclusion
The suitability of ketchup as a seasoning sauce for fries is in fact associated with different rheological properties which are anything but trivial. Yield stress, ThixotropyUntuk sebagian besar cairan, penipisan geser dapat dibalik dan cairan pada suatu saat akan mendapatkan viskositas aslinya ketika gaya geser dihilangkan.thixotropy, shear viscosity and shear rate of the process are all essential parameters for characterizing the behavior of the product during pouring from the bottle and during transition from a liquid-like behavior (indispensable for flowing through the neck) to a solid-like behavior (necessary for maintaining structure on the plate).