Introduction
The StressStress is defined as a level of force applied on a sample with a well-defined cross section. (Stress = force/area). Samples having a circular or rectangular cross section can be compressed or stretched. Elastic materials like rubber can be stretched up to 5 to 10 times their original length.stress σ resulting of a constant deformation ε0 applied on a polymer is time-dependent. [1] This is because the polymer chains rearrange in order to relax the stresses caused by the deformation. [2] As a consequence, the RelaxationWhen a constant strain is applied to a rubber compound, the force necessary to maintain that strain is not constant but decreases with time; this behavior is known as stress relaxation. The process responsible for stress relaxation can be physical or chemical, and under normal conditions, both will occur at the same time. relaxation modulus is time-dependent:
Moreover, assuming that a temperature increase does not change the molecular motions, but only accelerates them [3], the RelaxationWhen a constant strain is applied to a rubber compound, the force necessary to maintain that strain is not constant but decreases with time; this behavior is known as stress relaxation. The process responsible for stress relaxation can be physical or chemical, and under normal conditions, both will occur at the same time. relaxation modulus is not only dependent on time, but also on temperature:
Time and temperature are closely linked. A temperature rise will increase the free volume between the macromolecules. Thus, they will be more capable to slide over one another, reducing the RelaxationWhen a constant strain is applied to a rubber compound, the force necessary to maintain that strain is not constant but decreases with time; this behavior is known as stress relaxation. The process responsible for stress relaxation can be physical or chemical, and under normal conditions, both will occur at the same time. relaxation time of the material and other properties, e.g., its viscosity, its fracture resistance, its shear modulus, etc.
Oscillation Measurement
The upper plate oscillates with a defined frequency f [Hz] (or ω [rad/s]) and amplitude [%] (or shear StrainStrain describes a deformation of a material, which is loaded mechanically by an external force or stress. Rubber compounds show creep properties, if a static load is applied.strain γ [%]). The shear StressStress is defined as a level of force applied on a sample with a well-defined cross section. (Stress = force/area). Samples having a circular or rectangular cross section can be compressed or stretched. Elastic materials like rubber can be stretched up to 5 to 10 times their original length.stress σ [Pa] required for this oscillation is determined. Result: The visco-elastic properties of the sample are determined, in particular its elastic and loss shear moduli.
Actually, the behavior of most visco-elastic materials at one temperature can be predicted from the one at another temperature by a change in time scale [4]. Two different models describe the shift factor aT, i.e., the ratio of RelaxationWhen a constant strain is applied to a rubber compound, the force necessary to maintain that strain is not constant but decreases with time; this behavior is known as stress relaxation. The process responsible for stress relaxation can be physical or chemical, and under normal conditions, both will occur at the same time. relaxation times at temperatures T and Tr [2]:
- The Arrhenius shift, valid for semi-crystalline polymers and amorphous thermoplastics at temperatures higher than Tg + 100 K:
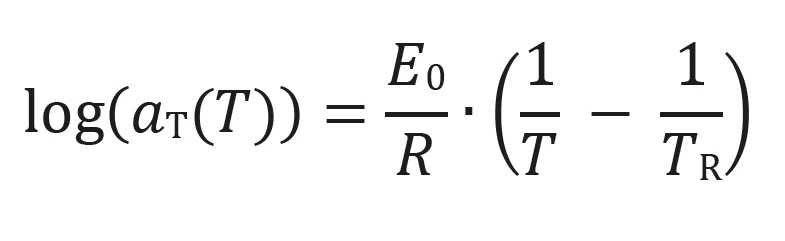
E0: Activation energy of RelaxationWhen a constant strain is applied to a rubber compound, the force necessary to maintain that strain is not constant but decreases with time; this behavior is known as stress relaxation. The process responsible for stress relaxation can be physical or chemical, and under normal conditions, both will occur at the same time. relaxation [J/mol]; R: Gas constant; TR: reference temperature [K]
- The WLF shift, valid for the temperatures around the Glass Transition TemperatureThe glass transition is one of the most important properties of amorphous and semi-crystalline materials, e.g., inorganic glasses, amorphous metals, polymers, pharmaceuticals and food ingredients, etc., and describes the temperature region where the mechanical properties of the materials change from hard and brittle to more soft, deformable or rubbery.glass transition:
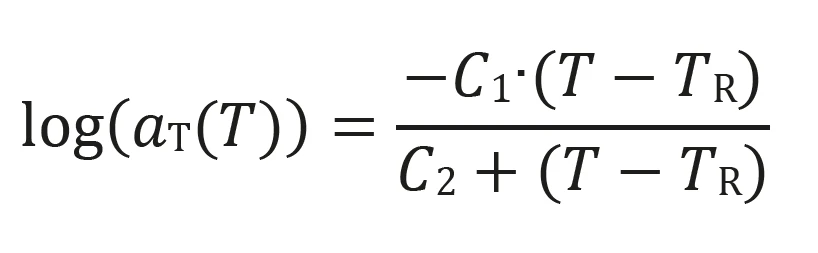
C1, C2: Parameters dependent on the material; TR: Reference temperature [K]
This possibility to shift the curves of a visco-elastic property is very convenient because it considerably reduces the measuring time. In the following, the time-temperature superposition principle is used to create a master curve on an asphalt binder. For that, frequency sweep measurements are carried out at different temperatures.
Table 1: Conditions of the oscillation measurements
| Device | Kinexus DSR |
| Measurement Mode | Oscillation, frequency sweep |
| Geometry | Plate-plate, diameter: 4 mm (PP4) |
| Gap | 1.7 mm |
| Temperature | -30°C, -15°C, 0°C, 15°C and 30°C |
| StrainStrain describes a deformation of a material, which is loaded mechanically by an external force or stress. Rubber compounds show creep properties, if a static load is applied.Strain | 0.017%, 0.079%, 0.020%, 0.398%, 0.796% |
| Frequency | 100 to 0.1 rad.s-1 |
Measurement Conditions and Results
Table 1 depicts the measurement conditions. Figures 1 to 5 display the resulting curves of the frequency sweep measurements at the five different temperatures. Figures 6, 7 and 8 compare the elastic shear modulus, the viscous shear modulus and the phase angle of all measurements.
The higher the temperature, the lower the elastic shear modulus. As expected, the asphalt binder gets stiffer with decreasing temperatures. At 30°C, the loss shear modulus is higher than the elastic shear modulus. At this temperature, the “liquid-like” properties of the material dominate its “solid-like” properties. Here, the phase angle is slightly higher than 45° over the entire frequency range (Figure 1). The material is a visco-elastic liquid.
The measurement at 15°C shows a crossover of the elastic and viscous shear modulus at a frequency of 2.5 rad.s-1 (Figure 2). At this point, the phase is exactly 45°. For lower frequencies than the frequency crossover, the liquid-like properties dominate.
The tests at 0°C, -15°C and -30°C show a reduction in phase angle with decreasing temperatures. However, the increase in phase angle in the direction of the lower frequencies shows that for all temperatures, the sample most probably is a visco-elastic liquid. The lower the temperature, the later the phase angle reaches the value of 45°.
The behavior of the asphalt at 0°C, or even lower temperatures, is important in order to predict its stability in cold countries. For that, the frequency of the crossover is crucial. However, it cannot be experimentally detected for practical reasons, as the measurement would take too much time. Luckily, the application of the time-temperature superposition explained enables creation of a master curve, i.e., the calculation of the desired curves at one specific temperature for a broader frequency range.
Figure 9 depicts the construction of the master curve of the elastic shear modulus at a temperature of 0°C. The curves measured at a lower temperature (-30°C, -15°C) and higher temperature (15°C, 30°C) than this reference temperature are shifted to the right and to the left by the shift factor aT, respectively. In other words, the RelaxationWhen a constant strain is applied to a rubber compound, the force necessary to maintain that strain is not constant but decreases with time; this behavior is known as stress relaxation. The process responsible for stress relaxation can be physical or chemical, and under normal conditions, both will occur at the same time. relaxation process occurs faster (shifted to higher frequencies) when the temperature increases. The calculation of the master curve and of the coefficients used for the Arrhenius and the WLF models occur automatically in the rSpace software (see Table 2).
One should note the frequency start of the master curve: 1.6·10-5 rad/s, this means a time of more than 170 hours (more than seven days!) only for the measurement of this single point! Such a test would be not be practical to perform.
Phase Angle
The phase angle δ (tan δ= G"/G´) is a relative measure of the viscous and elastic properties of a material. It ranges from 0° for a fully elastic material to 90° for a fully viscous material.
Table 2: Arrhenius and WLF coefficients calculated from the measurements for a reference temperature of 0°C. The WLF coefficients k1 and k2 correspond to C1 and C2 of the WLF equation; the Arrhenius coefficient k1 to the factor E0/R of the Arrhenius model.
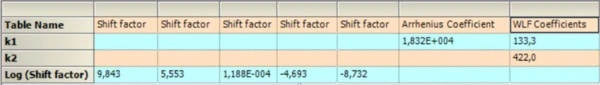
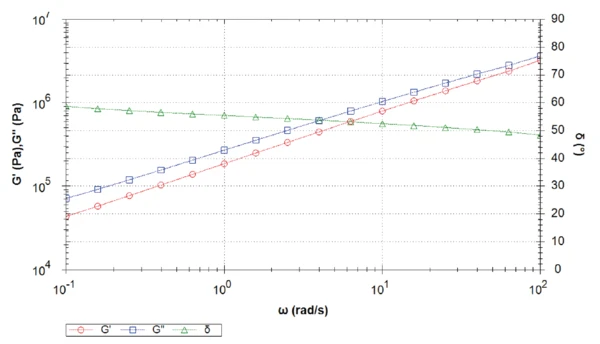
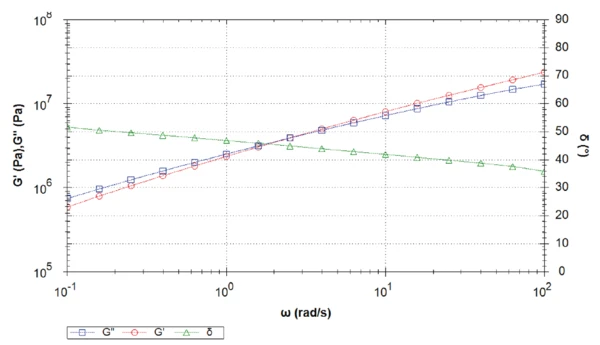
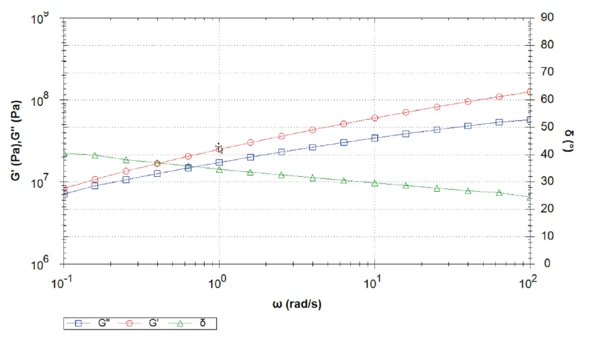
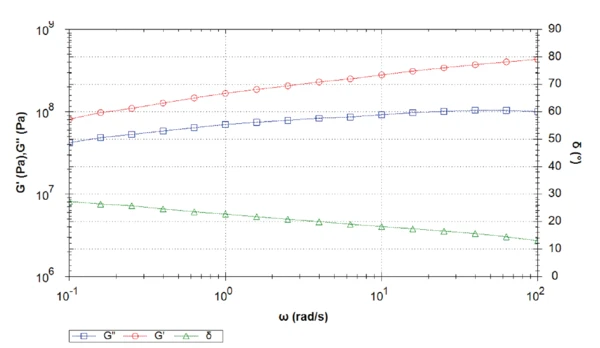
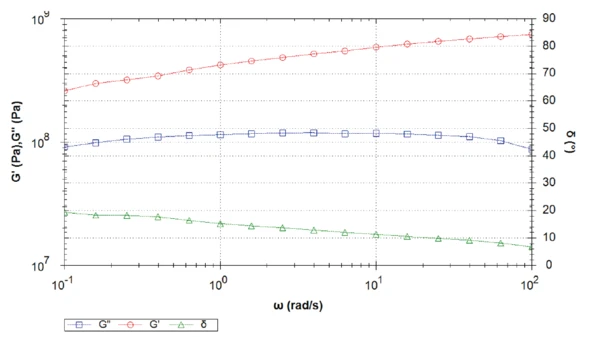
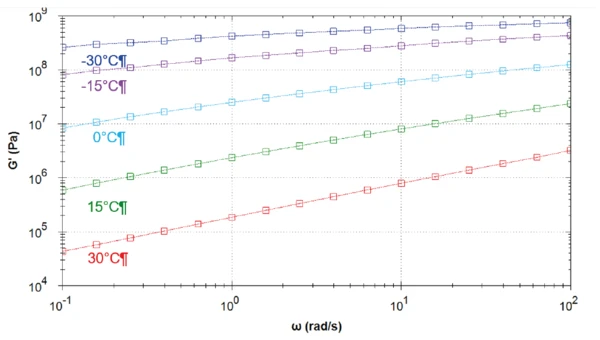
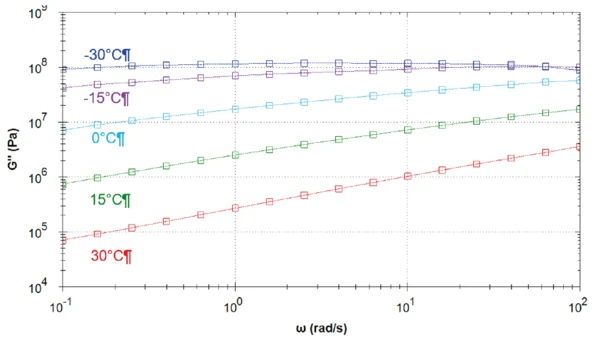
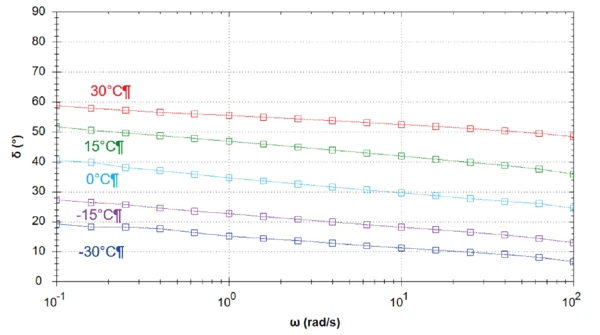
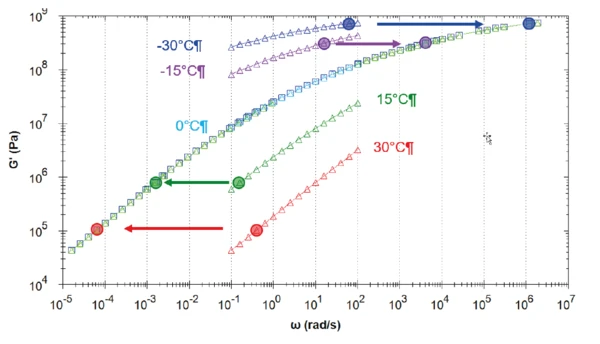
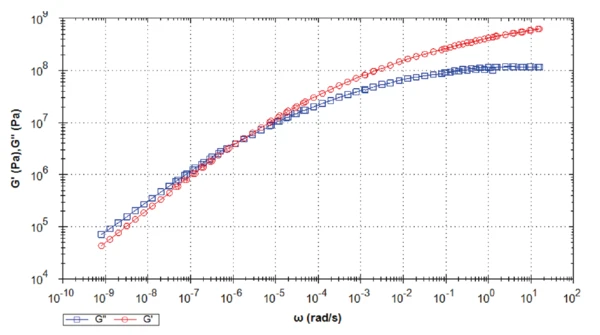
Table 3: Crossover determination of the elastic and viscous shear moduli master curves at different temperatures
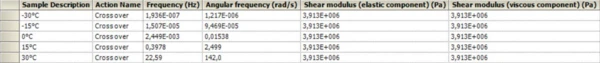
Figure 10 depicts the master curve of the asphalt binder for a temperature of -30°C. The lower the temperature, the lower the frequency range reached with the calculation. Here, the first point is below 10-9 rad·s-1! The crossover detected between 10-7 and 10-6 rad·s-1 would only have been detected by performing a very time-consuming measurement.
Table 3 summarizes the results of a crossover between the elastic and viscous shear moduli detected for all temperatures. The asphalt always behaves like a visco-elastic liquid for the specified temperatures. The lower the temperature, the lower the crossover frequency, and the longer the process to induce destabilization of the material structure.
If the crossover of the G‘ and G‘‘ curves occurs at 2.4∙10-3 Hz at a temperature of 0°C, this corresponds to a time scale of approx 7 min. This means that the material behaves predominantly elastic if the time scale is shorter than 7 min. In practice, this means that the road is stable under load within linear visco-elastic range. If the time scale is longer, there is an increasing tendency for the material to deform (formation of ruts).
If this asphalt binder is used in colder climates, e.g., at -30 °C, the crossover of the G‘ and G‘‘ is at a lower frequency, e.g., the time scale increases (here approx. 2 months).
Conclusion
The visco-elastic behavior of asphalt binder was determined at temperatures between -30°C and 30°C. The lower the test temperature, the lower the frequency of the crossover. The collection of the data points in the low-frequency range in order to get the crossover is related to very high measurement times (several weeks), and is therefore not convenient in practice. The time-temperature superposition principle made it possible to overcome this problem. Instead of performing interminable tests, oscillation measurements were carried out at five different temperatures over a usual frequency range. The resulting graphs were used for generation of the master curves.