
소개
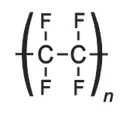
폴리테트라플루로에틸렌(PTFE)은 프라이팬 및 기타 조리기구의 눌어붙지 않는 코팅으로 일상적으로 사용되어 잘 알려져 있습니다. PTFE는 반응성이 매우 낮고 내화학성이 뛰어납니다. 이러한 특성으로 인해 의료 분야뿐만 아니라 부식성 및 반응성 화학 물질을 위한 용기 및 파이프 작업과 같은 산업 분야에서도 사용됩니다. 또한 슬라이딩 동작이 필요한 베어링, 부싱 및 기어와 같은 부품도 PTFE로 만들어집니다.
다양한 열 분석 및 열물리 특성 테스트 기법을 사용하여 PTFE 소재의 열 특성을 분석했습니다. 측정은 -170°C에서 700°C 사이에서 수행되었습니다(방법에 따라 다름). 열팽창 및 밀도 변화는 푸시로드 팽창 측정법(DIL, 예: ASTM E831, DIN 51045 기준)을 통해 측정했습니다. 점탄성 특성(저장 및 손실 계수)을 분석하기 위해 동적 기계 분석(DMA)을 사용했습니다. 열확산도는 레이저 비산회 기법(LFA, 예: ASTM E1461, DIN EN821에 기반)으로 측정했습니다. 열확산도 데이터를 특정 열 및 밀도와 결합하면 폴리머의 열전도도를 계산할 수 있습니다. 분해 거동은 동시 열 분석(STA, 예: ASTM E1131, ASTM D3850, DIN 51006, ISO 11357, DIN 51004, DIN 51007 등에 기반)을 사용하여 연구했습니다. 진화한 가스는 질량 분석기(QMS)와 푸리에 변환 적외선 분광기(FT-IR)로 분석했습니다.
PTFE는 전체 온도 범위에 걸쳐 여러 가지 전이를 보였습니다. 19°C 이하에서는 잘 정렬된 삼선상이 얻어지는 반면, 19°C에서 30°C 사이에서는 PTFE가 부분적으로 정렬된 육각형상을 형성합니다. 30°C 이상에서 녹는점(328°C)까지 이 소재는 매우 무질서한 유사 육각형 상으로 나타납니다. 115°C와 131°C에서는 비정질 상으로 인한 추가 전이가 발견될 수 있습니다[1]. 일부 문헌(예: [3], [4])에서는 131°C에서의 상 변형을 유리 전이라고 설명합니다.
폴리테트라플루로에틸렌 = PTFE
- 테플론®*으로 더 잘 알려져 있습니다
- 1938년 로이 플런켓에 의해 발견됨
- 분자식: CnF2n+2
- 분자 질량: 100.02 g/mol
- 밀도: 2.2g/cm³
- 녹는점: 327°C
*테프론®은 E.I. 듀폰 드 네무르 앤 컴퍼니의 등록 상표입니다.
이 연구에서 분석된 PTFE는 하이덴하임의 ElringKlinger Kunststofftechnik GmbH에서 제공했습니다.
테스트 결과
A) 점탄성 특성
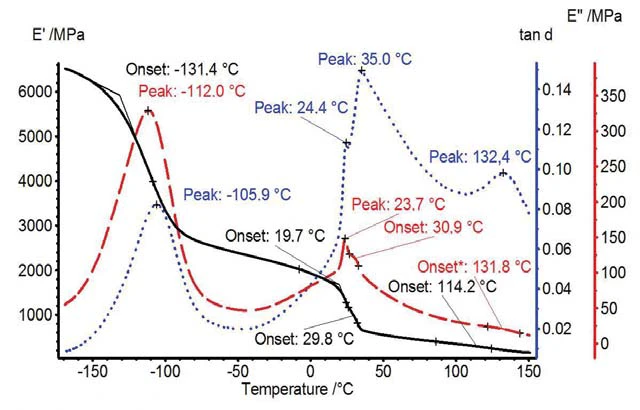
그림 1은 결정된 기계적 특성 E´, E´´ 및 tanδ를 보여줍니다. 131°C에서 저장 탄성률의 단계는 비정질상의 유리 전이에 기인할 수 있습니다. 20°C와 40°C 사이에서 두 개의 고체-고체 전이를 볼 수 있습니다. E´ 곡선의 또 다른 단계는 115°C에서 비정질상의 고체-액체 전이로 인해 관찰되었으며[1], 때로는 유리 전이[3], [4]로도 특징지어지기도 합니다.
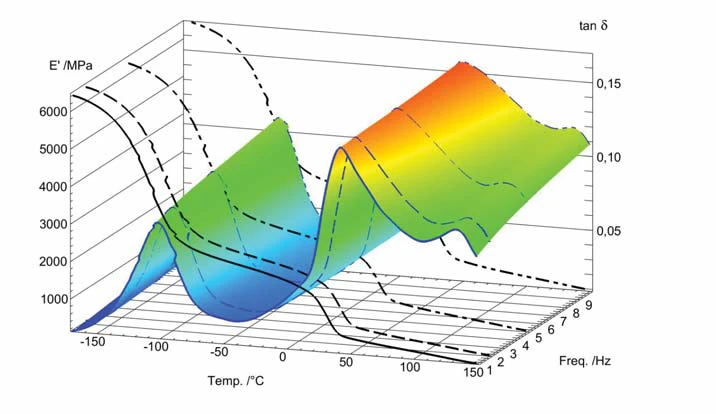
다중 주파수 측정(1, 2, 5, 10Hz)의 3D 플롯이 그림 2에 나와 있습니다. 주어진 온도에서 주파수에 따라 tanδ가 증가하는 것을 볼 수 있습니다.
B) 열팽창, 밀도 변화
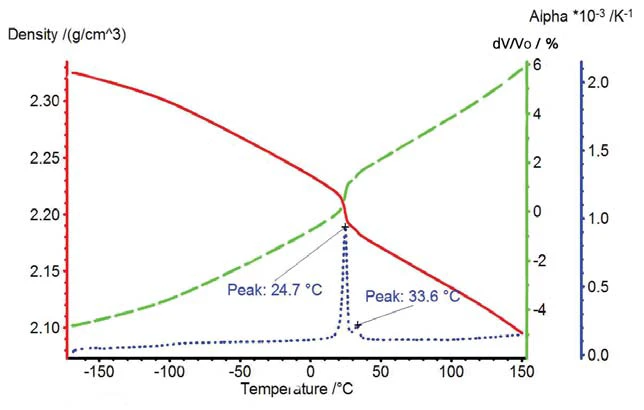
PTFE는 -170°C에서 20°C 사이에서 일정한 팽창률로 팽창합니다(그림 3). 상온에서는 고체-고체 전이로 인해 열팽창이 급격히 증가하는 것이 감지되었습니다. 상전이 위에서는 열팽창이 지속적으로 증가하며 팽창률이 약간 증가합니다.
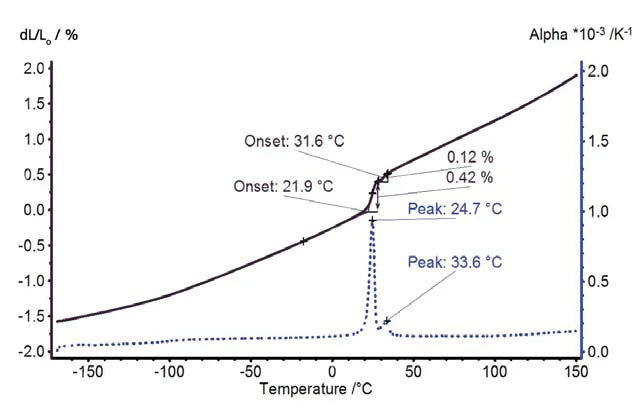
PTFE의 부피 팽창과 밀도 변화는 그림 4에 나와 있습니다. 고체-고체 전환은 1% 이상의 부피 변화에 해당합니다.
C) 열물리학적 특성
열 확산성, 밀도 변화 및 비열
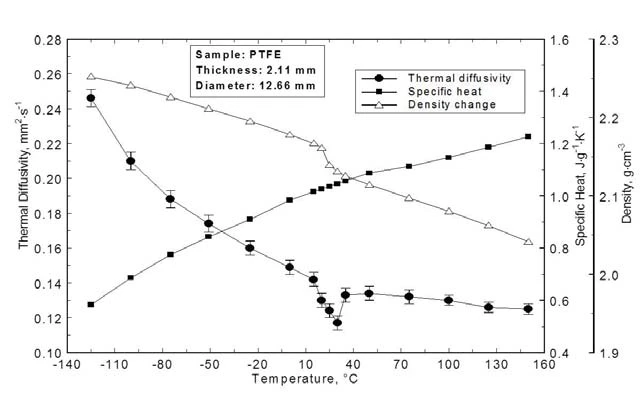
PTFE의 열 확산도, 비열 및 밀도 변화는 그림 5에 표시되어 있습니다. 확산도는 온도에 따라 지속적으로 감소하는데, 이는 포논 전도에 대한 고체 물리학에서 예상되는 현상입니다. RT에서의 고체-고체 전이는 명확하게 식별할 수 있지만 -131°C와 115°C에서의 다른 전이는 보이지 않습니다.
열전도율
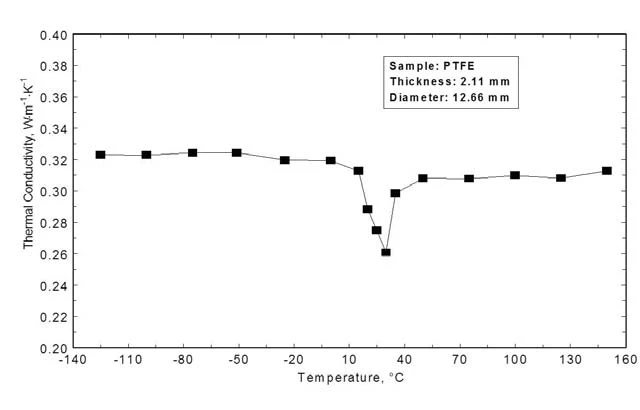
그림 6은 열 확산도, 비열 및 밀도를 통해 계산된 열전도도를 보여줍니다. 저온 범위에서 열전도율은 거의 일정합니다(0.32Wm-1K-1). 10°C에서 40°C 사이의 상전이 동안 열전도도는 10% 이상 감소하며, 신호가 다시 상승한 후 더 높은 온도에서도 열전도도는 상전이 전 영역에 비해 현저히 낮아집니다.
D) 열 분해, 가스 분석
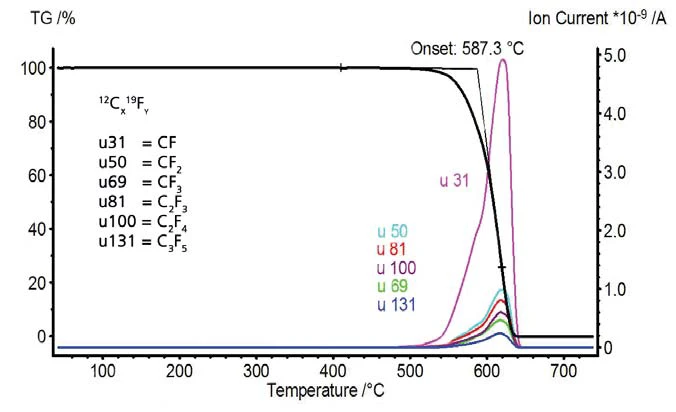
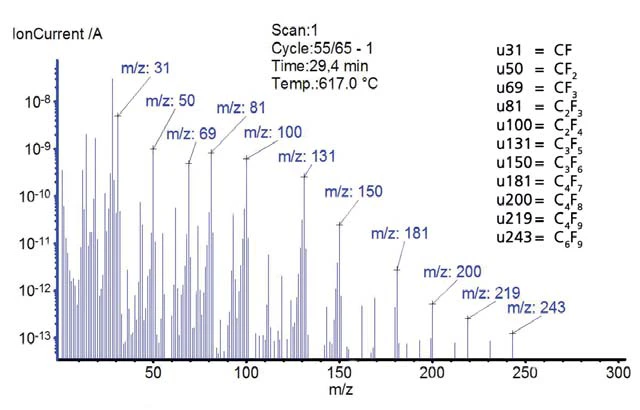
온도에 따른 질량 분석기의 질량 변화와 신호는 그림 7과 8에 나와 있습니다. PTFE는 587°C에서 열분해가 시작될 때까지 질량 손실이 나타나지 않습니다. 질량 분석기는 질량 번호 31, 50, 69, 81, 100, 131, 150, 181, 200, 219 및 243에 대한 이온 전류 강도의 변화를 감지했습니다. 이 질량 번호는 PTFE의 일반적인 조각을 나타냅니다. 폴리테트라플 우오로에틸렌은 완전히 분해되어 불활성 가스 대기 중에 잔류 질량이 남지 않습니다.
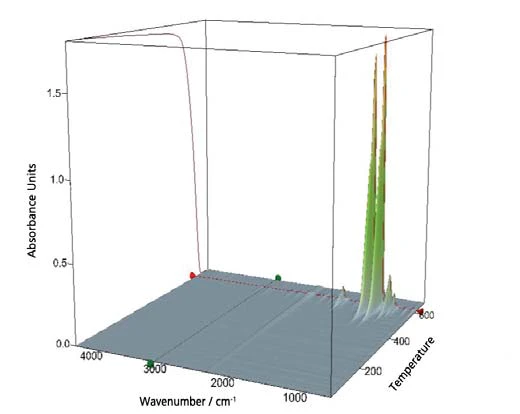
TGA-MS와 동시에 FT-IR 측정을 수행했습니다. 감지된 모든 IR 스펙트럼의 모음은 그림 9에 3차원 정육면체로 표시되어 있습니다. 또한 큐브의 측면에 있는 TGA 신호가 추가로 포함되어 있습니다.
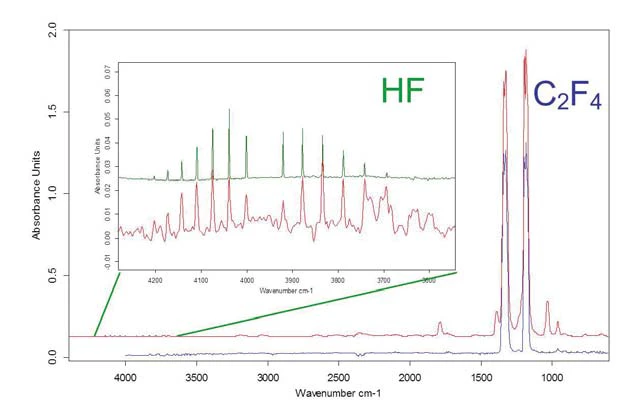
이 3D 플롯에서 가시 피크의 최대값에 가까운 온도에서 단일 스펙트럼을 추출하고(그림 10) 라이브러리 데이터와 비교했습니다. HF와 테트라플루오로에틸렌이 확인되었습니다.
결론
PTFE에 대한 이해를 높이기 위해 다양한 열물리학적 및 열역학적 특성을 테스트했습니다. 사용된 모든 열 분석 기법을 통해 고체-고체 전이를 확인할 수 있었습니다. 동적 기계적 분석만이 비정질 상과 관련된 전이를 감지할 수 있었습니다.