Introduction
Polytetraflouroethylene (PTFE) is well known from its daily application as a non-sticking coating for frying pans and other cookware. PTFE is very unreactive and provides high chemical resistance. Due to these properties, it is not only used in medical applications but also in the industry like, for example, in containers and pipe work for corrosive and reactive chemicals. Also parts like bearings, bushings and gears, where sliding action is needed, are made of PTFE.
Thermal characterization of a PTFE material was realized using various thermal analysis and thermophysical property testing techniques. Measurements were carried out between -170°C and 700°C (depending on the method). The thermal expansion and DensityThe mass density is defined as the ratio between mass and volume. density changes were determined by means of pushrod dilatometry (DIL, based on, e.g., ASTM E831, DIN 51045). Dynamic mechanical analysis (DMA) was used to analyze the visco-elastic properties (storage and Viscous modulusThe complex modulus (viscous component), loss modulus, or G’’, is the “imaginary” part of the samples the overall complex modulus. This viscous component indicates the liquid like, or out of phase, response of the sample being measurement. loss modulus). The Thermal DiffusivityThermal diffusivity (a with the unit mm2/s) is a material-specific property for characterizing unsteady heat conduction. This value describes how quickly a material reacts to a change in temperature.thermal diffusivity was measured with the laser fl ash technique (LFA, based on, e.g., ASTM E1461, DIN EN821. Combining Thermal DiffusivityThermal diffusivity (a with the unit mm2/s) is a material-specific property for characterizing unsteady heat conduction. This value describes how quickly a material reacts to a change in temperature.thermal diffusivity data with specifi c heat and DensityThe mass density is defined as the ratio between mass and volume. density allows for calculation of the Thermal ConductivityThermal conductivity (λ with the unit W/(m•K)) describes the transport of energy – in the form of heat – through a body of mass as the result of a temperature gradient (see fig. 1). According to the second law of thermodynamics, heat always flows in the direction of the lower temperature.thermal conductivity of the polymer. The Decomposition reactionA decomposition reaction is a thermally induced reaction of a chemical compound forming solid and/or gaseous products. decomposition behavior was studied using simultaneous thermal analysis (STA, based on, e.g., ASTM E1131, ASTM D3850, DIN 51006, ISO 11357, DIN 51004, DIN 51007, etc.). The evolved gases were analyzed by a mass spectrometer (QMS) and Fourier transform infrared spectroscopy (FT-IR).
PTFE exhibits several transitions over the entire temperature range. Below 19°C, a well ordered triclinic phase is obtained, whereas between 19°C and 30°C, PTFE forms a partially ordered hexagonal phase. Above 30°C and up to the Melting Temperatures and EnthalpiesThe enthalpy of fusion of a substance, also known as latent heat, is a measure of the energy input, typically heat, which is necessary to convert a substance from solid to liquid state. The melting point of a substance is the temperature at which it changes state from solid (crystalline) to liquid (isotropic melt).melting point (328°C), the material shows a pseudo-hexagonal, very disordered phase. Further transitions can be found at -115°C and 131°C which can be attributed to the amorphous phase [1]. Some literature sources (e.g., [3], [4]) describe the phase transformation at 131°C as a Glass Transition TemperatureThe glass transition is one of the most important properties of amorphous and semi-crystalline materials, e.g., inorganic glasses, amorphous metals, polymers, pharmaceuticals and food ingredients, etc., and describes the temperature region where the mechanical properties of the materials change from hard and brittle to more soft, deformable or rubbery.glass transition.
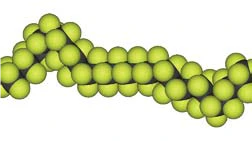
Polytetraflouroethylene = PTFE
- Better known as Teflon®*
- Discovered by Roy Plunkett in 1938
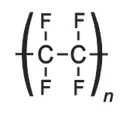
- Molecular formula: CnF2n+2
- Molecular mass: 100.02 g/mol
- DensityThe mass density is defined as the ratio between mass and volume. Density: 2.2 g/cm³
- Melting Temperatures and EnthalpiesThe enthalpy of fusion of a substance, also known as latent heat, is a measure of the energy input, typically heat, which is necessary to convert a substance from solid to liquid state. The melting point of a substance is the temperature at which it changes state from solid (crystalline) to liquid (isotropic melt).Melting point: 327°C
*Teflon® ist a registered trademark of E.I. DuPont de Nemours and Company.
The PTFE analyzed in this work was supplied by ElringKlinger Kunststofftechnik GmbH, Heidenheim.
Test Results
A) Viscoelastic Properties
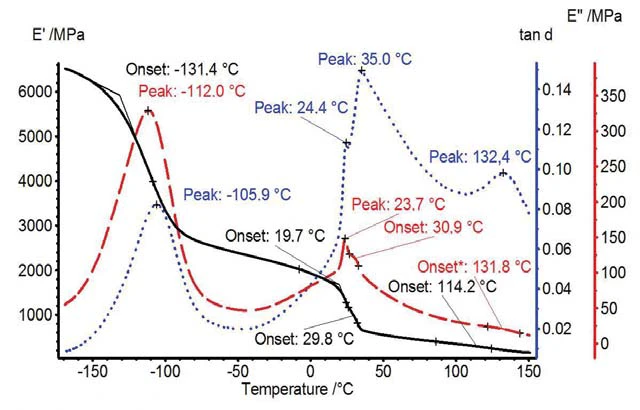
Figure 1 presents the determined mechanical properties E´, E´´ and tanδ. The step in storage modulus at -131°C can be attributed to the Glass Transition TemperatureThe glass transition is one of the most important properties of amorphous and semi-crystalline materials, e.g., inorganic glasses, amorphous metals, polymers, pharmaceuticals and food ingredients, etc., and describes the temperature region where the mechanical properties of the materials change from hard and brittle to more soft, deformable or rubbery.glass transition of the amorphous phase. Two solid-solid transitions can be seen between 20°C and 40°C. Another step in the E´ curve was observed at 115°C due to a solid-liquid transition of the amorphous phase [1], sometimes also characterized as Glass Transition TemperatureThe glass transition is one of the most important properties of amorphous and semi-crystalline materials, e.g., inorganic glasses, amorphous metals, polymers, pharmaceuticals and food ingredients, etc., and describes the temperature region where the mechanical properties of the materials change from hard and brittle to more soft, deformable or rubbery.glass transition [3], [4].
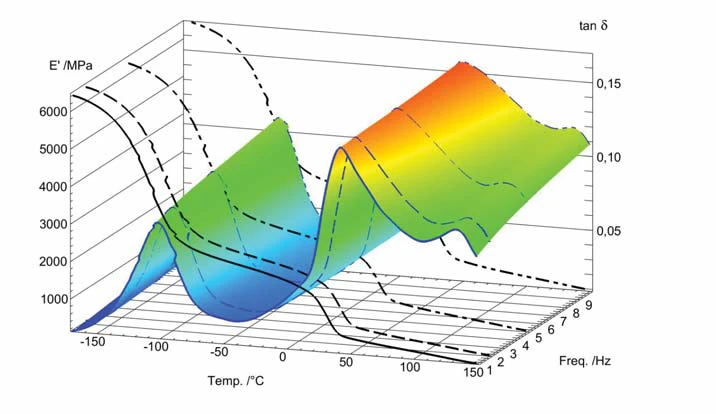
A 3-D plot of a multi-frequency measurement (1, 2, 5 and 10 Hz) is shown in figure 2. It can be seen that tanδ is increasing with frequency at a given temperature.
B) Thermal Expansion, DensityThe mass density is defined as the ratio between mass and volume. Density Change
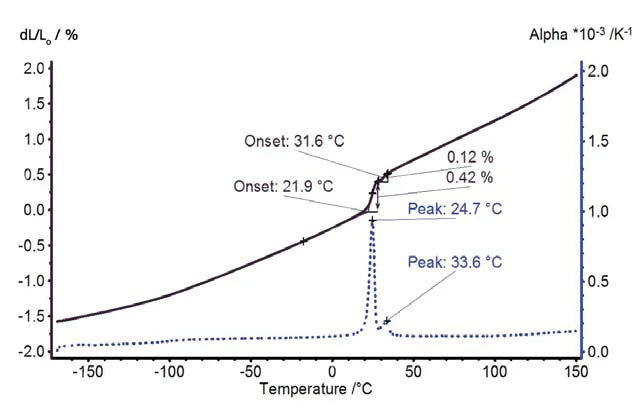
PTFE expands with a constant rate of expansion between -170°C and 20°C (figure 3). A jump in the thermal expansion was detected at room temperature due to the solid-solid transition. Above the Phase TransitionsThe term phase transition (or phase change) is most commonly used to describe transitions between the solid, liquid and gaseous states.phase transition, the thermal expansion continuously increases with a slightly increasing expansion rate.
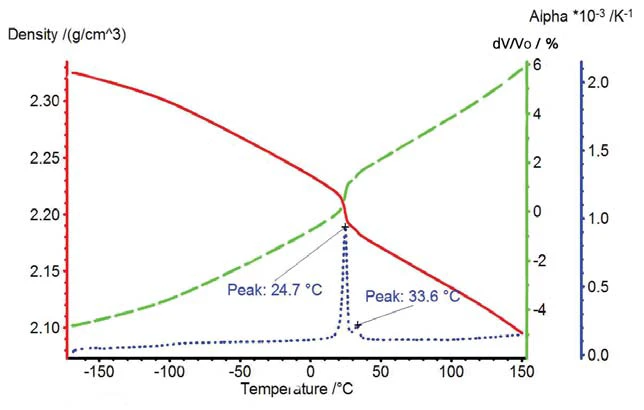
The Volumetric ExpansionThe volume of a gas, solid or liquid changes if the temperature, the pressure or the forces acting on that gas/solid/liquid change. In the case of thermal analysis, we are looking at temperature-dependent changes.volumetric expansion and DensityThe mass density is defined as the ratio between mass and volume. density change of PTFE are depicted in figure 4. The solid-solid transition corresponds to a volume change of more than 1%.
Thermal DiffusivityThermal diffusivity (a with the unit mm2/s) is a material-specific property for characterizing unsteady heat conduction. This value describes how quickly a material reacts to a change in temperature.Thermal Diffusivity, DensityThe mass density is defined as the ratio between mass and volume. Density Change and Specific Heat
The Thermal DiffusivityThermal diffusivity (a with the unit mm2/s) is a material-specific property for characterizing unsteady heat conduction. This value describes how quickly a material reacts to a change in temperature.thermal diffusivity, specific heat and DensityThe mass density is defined as the ratio between mass and volume. density change of PTFE are displayed in figure 5. The diffusivity continuously decreases with temperature; this is expected from the solidstate physics for phonon conduction. The solid-solid transition at RT can clearly be identified whereas the other transitions at -131°C and at 115°C are not visible.
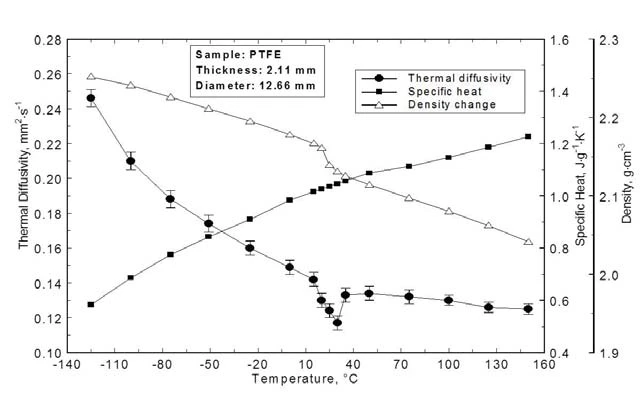
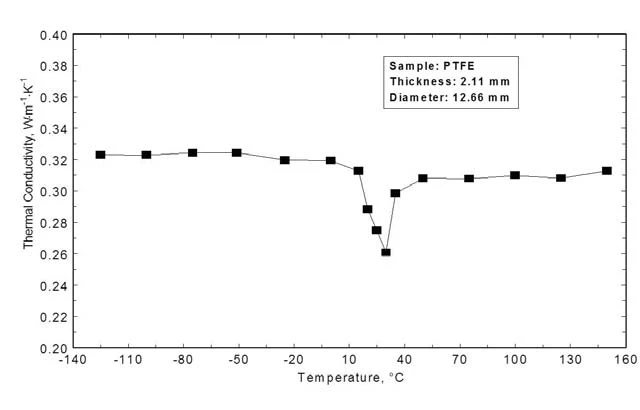
Figure 6 shows the Thermal ConductivityThermal conductivity (λ with the unit W/(m•K)) describes the transport of energy – in the form of heat – through a body of mass as the result of a temperature gradient (see fig. 1). According to the second law of thermodynamics, heat always flows in the direction of the lower temperature.thermal conductivity calculated by means of Thermal DiffusivityThermal diffusivity (a with the unit mm2/s) is a material-specific property for characterizing unsteady heat conduction. This value describes how quickly a material reacts to a change in temperature.thermal diffusivity, specific heat and DensityThe mass density is defined as the ratio between mass and volume. density. In the low-temperature range, the Thermal ConductivityThermal conductivity (λ with the unit W/(m•K)) describes the transport of energy – in the form of heat – through a body of mass as the result of a temperature gradient (see fig. 1). According to the second law of thermodynamics, heat always flows in the direction of the lower temperature.thermal conductivity is almost constant (0.32 Wm-1K-1). During the Phase TransitionsThe term phase transition (or phase change) is most commonly used to describe transitions between the solid, liquid and gaseous states.phase transition between 10°C and 40°C, the Thermal ConductivityThermal conductivity (λ with the unit W/(m•K)) describes the transport of energy – in the form of heat – through a body of mass as the result of a temperature gradient (see fig. 1). According to the second law of thermodynamics, heat always flows in the direction of the lower temperature.thermal conductivity decreases by more than 10% and even at higher temperatures – after the signal raised again – the Thermal ConductivityThermal conductivity (λ with the unit W/(m•K)) describes the transport of energy – in the form of heat – through a body of mass as the result of a temperature gradient (see fig. 1). According to the second law of thermodynamics, heat always flows in the direction of the lower temperature.thermal conductivity is significantly lower compared to the region prior to the phase change.
D) Thermal Decomposition, Gas Analysis
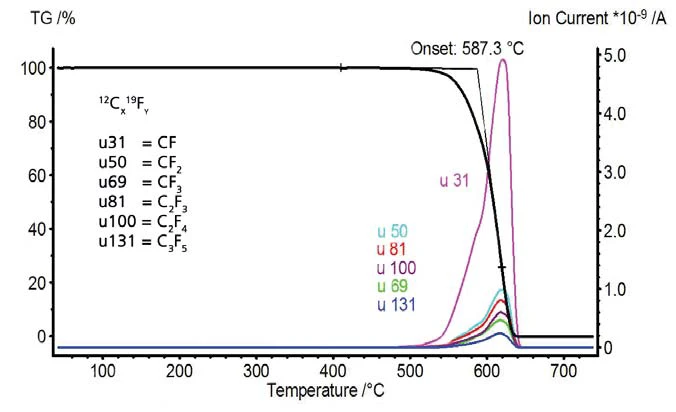
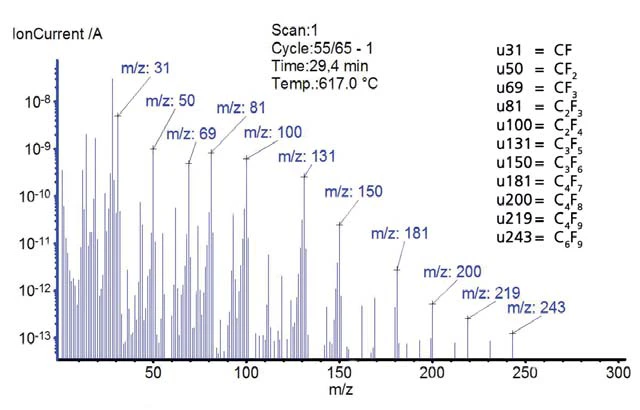
The temperature-dependent mass changes and signals of the mass spectrometer are depicted in figures 7 and 8. PTFE shows no mass loss until the pyrolytic Decomposition reactionA decomposition reaction is a thermally induced reaction of a chemical compound forming solid and/or gaseous products. decomposition starts at 587°C. The mass spectrometer detected changing ion current intensities for mass numbers 31, 50, 69, 81, 100, 131, 150, 181, 200, 219 and 243. These mass numbers indicate typical fragments of PTFE. Polytetrafl uoroethylene completely decomposes; no residual mass remains in the inert gas atmosphere.
Simultaneously to the TGA-MS, an FT-IR measurement was performed. A collection of all detected IR-spectra is shown as a 3-dimensional cube in figure 9. Additionally, the TGA signal at the side face of the cube is additionally included.
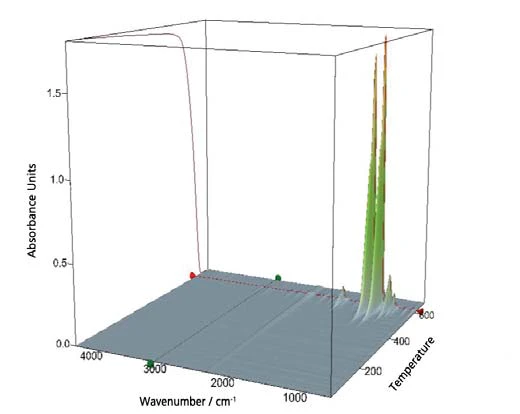
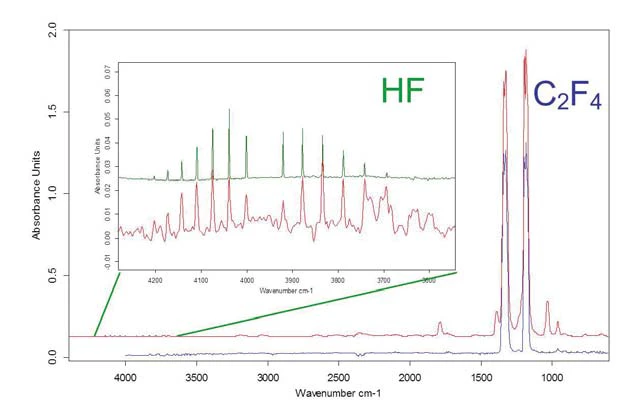
From this 3-D plot, single spectra at a temperature close to the maxima of the visible peaks were extracted (figure 10) and compared to library data. HF and tetrafluoroethylene were identified.
Conclusion
Various thermophysical and thermomechanical properties were tested to get a better understanding of PTFE. The solid-solid transition could be identified by all thermal analysis techniques employed. Only dynamic mechanical analysis was able to detect transitions related to the amorphous phase.