Introduction
Ophthalmic Viscosurgical Devices (OVDs) are viscoelastic solutions or gels used to protect the corneal endothelium from mechanical trauma and to maintain intraocular space during eye surgery. They usually contain one or more of the following components; hyaluronic acid or its sodium salt, chondroitin sulfate or methylcellulose. As these materials are polymeric, they tend to be visco-elastic with their properties strongly dependent on factors such as concentration, molecular weight and molecular architecture as well as intra- or inter-molecular interactions in solution.
OVDs can be classified according to their ‘cohesiveness or dispersiveness’ which are ultimately related to their rheological properties. Cohesive OVDs are high-viscosity materials that adhere to one another through molecular associations. They tend to have higher molecular weights and are highly Shear ThinningThe most common type of non-Newtonian behavior is shear thinning or pseudoplastic flow, where the fluid viscosity decreases with increasing shear.shear thinning with high surface tension. Because of their high viscosity, cohesive OVDs are able to pressurize the eye and create space for insertion of the optical implant (lens). Their cohesiveness also facilitates easy removal at the end of surgery as the entire mass sticks together. In contrast, dispersive OVDs tend to be lower in molecular weight and are more Newtonian. They have lower viscosities and lower surface tension making them better able to coat and adhere to both tissues and surgical instruments, and also help lubricate the optical implant during insertion. Dispersive OVDs tend to be more difficult to remove after surgery due to their higher fluidity. In addition to the two classes just described, there are also combination OVDs which incorporate dispersive and cohesive properties and visco-adpative OVDs which display different properties depending on the conditions of use.
There is now an International Standard (ISO15798:2013) detailing the requirements for characterizing these materials in terms of their biological, chemical and physical characteristics. For the purpose of this application note, we are concerned with the section of the standard dealing with rheological characterisation. The standard states that the product should be tested in its finished and sterilized state at 25°C for rheological testing and involves both oscillatory and steady shear testing respectively for characterising both viscoelastic and flow characteristics in terms of the dynamic viscosity, complex viscosity and viscoelastic moduli.
The complex viscosity is measured as a function of oscillation frequency using logarithmic increments to simultaneously demonstrate the resistance to flow and deformation of the OVD formulation. The frequency range specified is between 0.001 Hz and 1000 Hz but 0.01 Hz to 100 Hz is considered acceptable so long as the zero shear viscosity plateau (at diminishing frequencies) is accessible. This will occur at lower frequencies for higher viscosity materials. Often it is not possible to achieve 100 Hz on a rotational rheometer due to inertial limitations and hence one should aim for the highest achievable frequency.
The elasticity or viscoelasticity of the OVD is characterised through G’ and G” and is measured simultaneously with n* up to a frequency of 100 Hz ideally, or as high as high is possible considering inertia limitations. Data should either be presented on a double logarithmic scale against frequency or as a plot of percent elasticity against log frequency, for example as 100 × [G’/ (G’+G”] versus log frequency.
For steady shear measurements, the suggested shear rate range is from 0.001 s-1 to approximate the zero shear viscosity, representative of conditions within the anterior chamber, to a shear rate of approximately 100 s-1, to replicate conditions when the viscoelastic fluid is being injected into the eye through a cannula. The shear rates should be increased in logarithmic increments and steady shear viscosity data presented as a function of shear rate on a double logarithmic scale. Since measuring low-viscosity fluids at low shear rates can be problematic, the lowest shear rate at which the zero shear viscosity can be attained is deemed acceptable. The zero shear viscosity plateau tends to appear at higher shear rates for low viscosity materials and lower shear rates for high-viscosity materials so low shear rates are not always needed. Note that the steady shear zero shear viscosity should correspond with the equivalent value of n* measured using oscillatory testing.
Experimental
- An OVD formulation containing hyaluronic acid at three different concentrations 15 mg/ml, 18 mg/ml and 25 mg/ml was analyzed and compared according to ISO15798:2013.
- Rotational rheometer measurements were made using a Kinexus rotational rheometer with a Peltier plate cartridge and using 4°/40 mm cone-plate measuring system for oscillatory measurements and a 2°/20 mm cone-plate for viscometry tests.
- A standard loading sequence was used to ensure that both samples were subject to a consistent and controllable loading protocol. All rheology measurements were performed at 25°C.
- A StrainStrain describes a deformation of a material, which is loaded mechanically by an external force or stress. Rubber compounds show creep properties, if a static load is applied.strain controlled frequency sweep within the pre-determined linear viscoelastic was performed to determine G’, G” and η* as a function of frequency.
- An equilibrium table of shear rates test was performed to determine the steady state shear (dynamic) viscosity as a function of shear rate.
- Values of η0 were attained by means of a Cross-model analysis within the rSpace software
Results and Discussion
Oscillation Testing
The complex viscosity curves as a function of angular frequency (ω = 2πf) are shown in Figure 1. These curves are typical of a viscoelastic fluid, where at high frequencies the complex viscosity is low (more elastic) and increases with decreasing frequency as elastic energy is converted to viscous energy, culminating in a constant viscosity plateau. The onset of this constant viscosity or zero shear viscosity plateau (n*0) is clearly visible for all samples with the higher concentrations having higher viscosities.
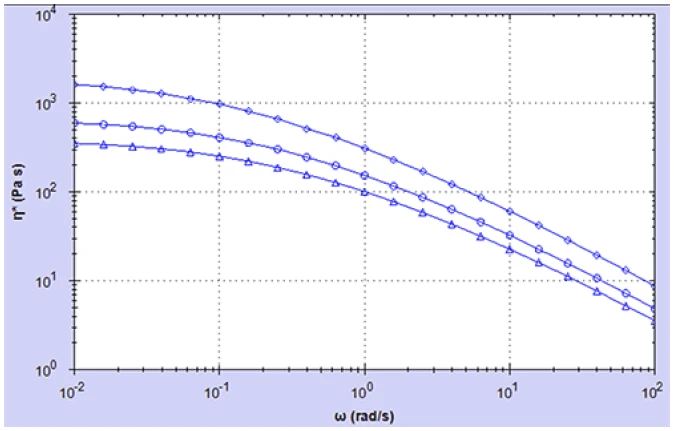
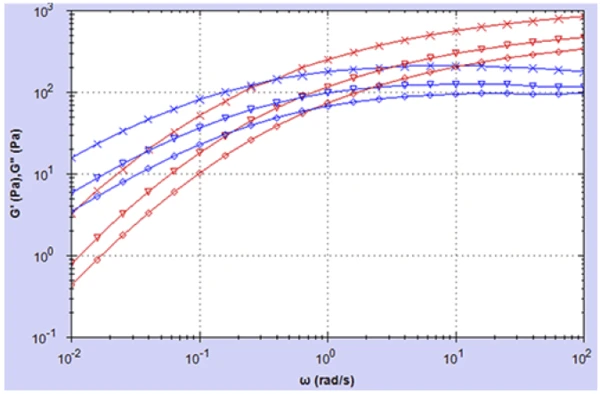
Figure 2 shows G’ and G” curves over the same frequency range for the three HA solutions. At high frequencies ,the Elastic modulusThe complex modulus (elastic component), storage modulus, or G’, is the “real” part of the samples the overall complex modulus. This elastic component indicates the solid like, or in phase, response of the sample being measurement. elastic modulus G’ is dominant, concomitant with a low value of n* and decays with decreasing frequency (increasing time) as elastic energy is converted into viscous energy, consistent with the increase and eventual plateau in n*.
The G’/G” crossover indicates a transition from elastic dominant (pseudo-gel like) behavior to liquid dominant behavior with the inverse of the crossover frequency 1/ωc representing the longest RelaxationWhen a constant strain is applied to a rubber compound, the force necessary to maintain that strain is not constant but decreases with time; this behavior is known as stress relaxation. The process responsible for stress relaxation can be physical or chemical, and under normal conditions, both will occur at the same time. relaxation time of the material or the time it takes for approx. 63% of the elastic energy or StressStress is defined as a level of force applied on a sample with a well-defined cross section. (Stress = force/area). Samples having a circular or rectangular cross section can be compressed or stretched. Elastic materials like rubber can be stretched up to 5 to 10 times their original length.stress to be dissipated as the polymer relaxes. The modulus at this crossover point can be referred to as the ‘crossover modulus’ (Gc) and is a measure of the total stiffness at this angular frequency. As with n*, the HA solutions with the highest concentrations have the largest values of G’ across all frequencies and also the longest RelaxationWhen a constant strain is applied to a rubber compound, the force necessary to maintain that strain is not constant but decreases with time; this behavior is known as stress relaxation. The process responsible for stress relaxation can be physical or chemical, and under normal conditions, both will occur at the same time. relaxation time. This is consistent with a higher number of inter-molecular interactions or entanglements making these materials behave more elastic for longer when stressed.
Viscometry Testing
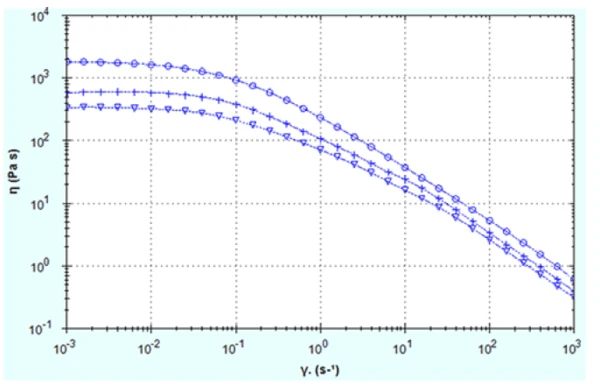
Steady state flow curves for the three HA solutions are shown in Figure 3. All samples are Shear ThinningThe most common type of non-Newtonian behavior is shear thinning or pseudoplastic flow, where the fluid viscosity decreases with increasing shear.shear-thinning or pseudoplastic showing a drop in viscosity with increasing shear rate which largely mirrors the complex viscosity vs angular frequency curves in Figure 1. This is one of the reasons complex viscosity data is plotted against angular frequency, since angular frequency can be equivocated with shear rate and for simple liquid and polymeric systems n*(ω) ≈ n(γ) as ω tends to zero. In this case n and n* data agree very well in the low frequency, low shear rate region with comparable values of n0 and the same concentration trend.
Data Analysis
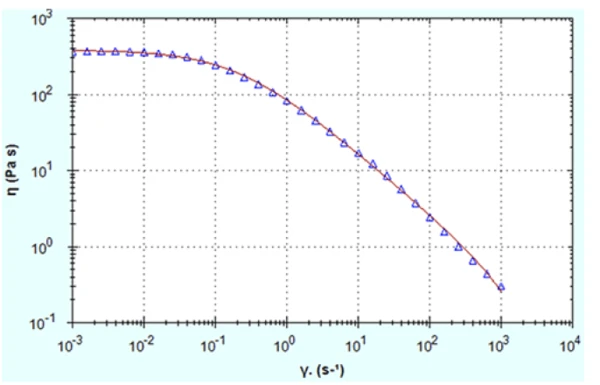
The zero shear viscosity can be estimated directly by taking a single point or an average of multiple points within the zero shear viscosity plateau. An alternative and often preferred method is to apply a rheological model which is known to fit curves of this type very well. These models include the Cross and Carreau models which are available within the rSpace software. These can be fitted to both n*(ω) and n(γ) data, as long as the correlation coefficient for the fit is high. Figure 4 shows a Cross model fitted to viscosity-shear rate data for the 15 mg/ml HA solution and demonstrates how well this model fits the data.
Zero shear viscosity for all samples based on cross model fitting of n*(ω) and n*(γ) data are listed in Table 1. Automated crossover analysis data for G’ and G” curves are also reported.
Higher values of n0 indicate lower mobility and hence more cohesive properties while lower values indicate better dispersiveness. In terms of G’ and G” data, a lower Cross over pointIn rheological test such as a frequency sweep or a time/temperature sweep, the cross over point is a convenient point of reference to indicate a “transition” point of the sample. cross over frequency (ωc) and higher crossover modulus (Gc) would indicate a more cohesive structure, while a higher value of ωc and lower value of Gc would indicate a more dispersive system. More generally dispersive OVDs tend to have n0 values less than 50 Pas and cohesive OVDs anywhere between 100 and 100000 Pas with these higher viscosities usually associated with higher values of Gc and lower values of ωc. According to this criteria, the three solutions tested would be classified as being more cohesive than dispersive in nature.
Table 1: Reported values for the zero shear viscosity n0), crossover frequency (ωc) and crossover modulus (Gc) following cross model fitting and crossover analysis, respectively
| HA Concentration | n0 (Pa.s) | n*0 (Pa.s) | ωc(rad/s) | Gc(PA) |
|---|---|---|---|---|
| 15 mg/ml | 365 | 389 | 0.768 | 62 |
| 18 mg/ml | 623 | 660 | 0.094 | 85 |
| 25 mg/ml | 1867 | 1919 | 0.064 | 145 |
Conclusion
The rheological properties of an HA-based OVD at three different HA concentrations were evaluated according to ISO15798:2013 using a Kinexus rotational rheometer. This involved measuring the steady state dynamic shear viscosity, complex viscosity and viscoelastic moduli (G’ and G”). The different samples were characterized and compared in terms of their zero shear viscosities and RelaxationWhen a constant strain is applied to a rubber compound, the force necessary to maintain that strain is not constant but decreases with time; this behavior is known as stress relaxation. The process responsible for stress relaxation can be physical or chemical, and under normal conditions, both will occur at the same time. relaxation profiles respectively in order to better classify them in terms of their ‘cohesive and dispersive’ properties.