Введение
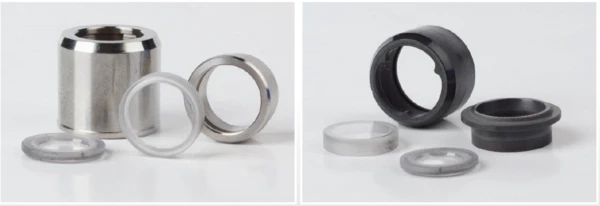
Для измерений LFA требуется определенная толщина образца. Тепловая диффузия (a) пропорциональна квадрату толщины образца (d): a ~ d². Это требует высокой точности для получения точного значения толщины. Кроме того, тепловой поток через внешние стенки контейнера в осевом направлении может быть критичным для держателей образцов для жидкостей. Кроме того, измерения расплавов металлов могут привести к разрушению держателя образца. Для решения этих критических проблем был разработан новый держатель образцов специально для "жидких металлов "* (рис. 1). Специальная конструкция, в которой часть деталей изготовлена из нержавеющей стали или SiC, а внутренняя часть - из сапфира, позволяет проводить измерения с отличными сигналами ИК-детектора и, следовательно, с высокой точностью. Металл помещается в сапфировый тигель, который закрывается сверху сапфировой крышкой. Определенная толщина образца в расплаве достигается путем размещения дополнительной массы на сапфировой крышке. Это обеспечивает гибкое позиционирование крышки по высоте и предотвращает повреждение сапфировой части в результате осевого теплового расширения металла.
*В данном контексте термин "жидкие металлы" относится к держателям образцов, которые позволяют проводить измерения при температурах, превышающих температуру плавления металлов.
Условия испытаний
- Материал: Алюминиевый сплав
- Инструменты: LFA 467 HT HyperFlash/DSC 404 F1 Pegaus
- Диапазон температур: 450 °C → 750 °C → 450 °C
- Держатель образца: Для жидкостей и металлов; из сапфира; в исполнении из SiC, нержавеющей стали (до 750°C) и SiC (до 1250°C)
- Диапазон температур: 450 °C → 750 °C → 450 °C
- Толщина образца: 1,5 мм
- Подготовка поверхности образца: Тонкое графитовое покрытие
Результаты измерений
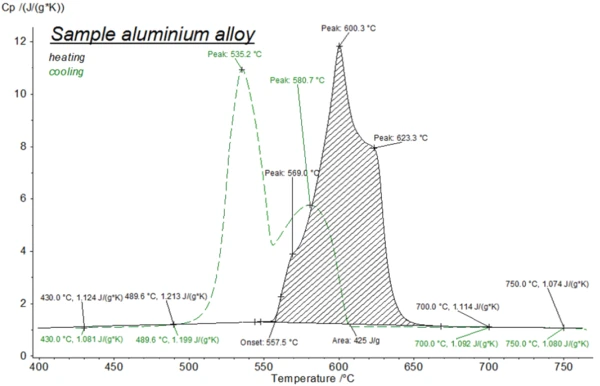
Пригодность нового держателя образцов для жидкостей в сочетании с LFA 467 HT была проверена с помощью серии измерений на алюминиевом сплаве. Перед испытанием LFA были проведены дополнительные измерения ДСК. На рисунке 2 показан фазовый переход при нагревании и охлаждении в ДСК. При нагревании (черная кривая) многоступенчатое плавление сплава начинается при 558°C (начало, температура солидуса) с пиковыми температурами при 569°C и 600°C. Последний этап завершается при 623°C (температура ликвидуса). В цикле охлаждения виден небольшой эффект переохлаждения (пунктирная зеленая линия). Процесс кристаллизации начинается между 610°C и 600°C, примерно на 10-15 K ниже температуры ликвидус, определенной во время нагрева. Кристаллизация заканчивается при температуре 535°C.
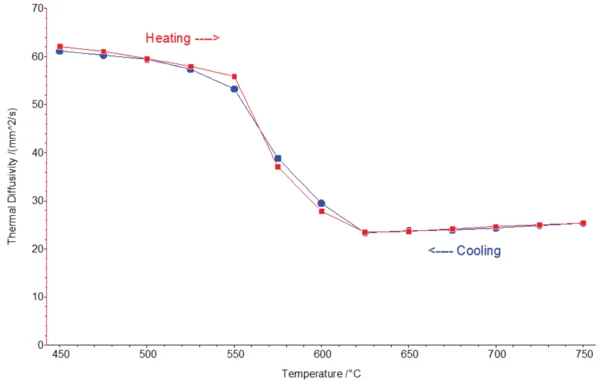
На рисунке 3 показана теплопроводность алюминиевого сплава при нагревании и охлаждении (измерения LFA). Значения при плавлении и кристаллизации находятся в очень хорошем согласии, что указывает на отличную стабильность сигнала ИК-детектора и стабильность условий как внутри, так и вне фазовых переходов (например, постоянная толщина пленки жидкость/твердый металл). Температура солидуса определяется между 550°C и 575°C (для сравнения, ДСК: 558°C), а температура ликвидуса - между 600°C и 625°C (для сравнения, ДСК: 623°C). Хорошее согласие между двумя независимыми приборами демонстрирует высокую температурную точность LFA 467 HT.
Расчет теплопроводности λ(T) основан на следующем уравнении:
где
ρ = плотность
α = температуропроводность
Удельная теплоемкость (cp)Теплоемкость - это специфическая для каждого материала физическая величина, определяемая количеством тепла, подведенного к образцу, деленным на полученное повышение температуры. Удельная теплоемкость относится к единице массы образца.cp = удельная теплоемкость
Плотность, ρ, может быть определена при комнатной температуре по объему и массе. Для получения точных результатов можно использовать дилатометр, чтобы учесть тепловое расширение и изменение плотности в зависимости от температуры. Измеренные/вычисленные кривые ДСК Удельная теплоемкость (cp)Теплоемкость - это специфическая для каждого материала физическая величина, определяемая количеством тепла, подведенного к образцу, деленным на полученное повышение температуры. Удельная теплоемкость относится к единице массы образца.cp*(T) содержат вклад энтальпий фазовых переходов Δhphase и могут быть описаны как:
Удельная теплоемкость (cp)Теплоемкость - это специфическая для каждого материала физическая величина, определяемая количеством тепла, подведенного к образцу, деленным на полученное повышение температуры. Удельная теплоемкость относится к единице массы образца.cp* dT = Удельная теплоемкость (cp)Теплоемкость - это специфическая для каждого материала физическая величина, определяемая количеством тепла, подведенного к образцу, деленным на полученное повышение температуры. Удельная теплоемкость относится к единице массы образца.cp dT + dhphase
Чтобы получить "истинную" удельную теплоемкость Удельная теплоемкость (cp)Теплоемкость - это специфическая для каждого материала физическая величина, определяемая количеством тепла, подведенного к образцу, деленным на полученное повышение температуры. Удельная теплоемкость относится к единице массы образца.cp(T), необходимую для расчета теплопроводности, необходимо вычесть энтальпию фазового перехода:
Удельная теплоемкость (cp)Теплоемкость - это специфическая для каждого материала физическая величина, определяемая количеством тепла, подведенного к образцу, деленным на полученное повышение температуры. Удельная теплоемкость относится к единице массы образца.cp dT = Удельная теплоемкость (cp)Теплоемкость - это специфическая для каждого материала физическая величина, определяемая количеством тепла, подведенного к образцу, деленным на полученное повышение температуры. Удельная теплоемкость относится к единице массы образца.cp* dT - dhphase
Обычно это делается путем линейной интерполяции в диапазоне фазовых переходов.
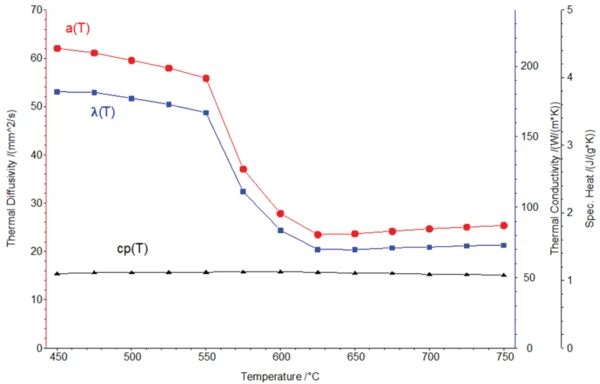
На рисунке 4 представлены теплофизические свойства алюминиевого сплава, включая рассчитанную теплопроводность для фазового перехода твердое тело-жидкость.
Резюме
NETZSCH разработала новый держатель образцов для "жидких металлов "* для прибора LFA 467 HT HyperFlash®, который может поставляться в двух вариантах, рассчитанных на температуру до 750°C и 1250°C соответственно. Измерения на жидком алюминиевом сплаве наглядно демонстрируют высокую воспроизводимость результатов при нагреве (плавлении) и охлаждении (кристаллизации). Специальная конструкция держателя образца обеспечивает постоянную толщину образца во время плавления. В то же время она предотвращает механическое давление на сапфировые детали, возникающее в результате теплового расширения. Благодаря отличной стабильности сигнала была достигнута высокая точность при низком уровне рассеяния. Кроме того, было получено хорошее соответствие с результатами ДСК, а обнаруженные температуры фазовых переходов находились в ожидаемом диапазоне.
*В данном контексте термин "жидкие металлы" относится к держателям образцов, которые облегчают проведение измерений при температурах, превышающих температуру плавления металлов.