Introduction
For the reinforcement of rubber components such as car tires, conveyor belts or v-belts, tire cords and/or meshed materials are used. During the production process, these materials are vulcanized to become the rubber compound. However, it is not only the dynamic-mechanical properties of a rubber compound or a mesh that are of interest. Information on the adhesion between the tire cord and rubber is also often needed; this is mainly affected by the temperature, material properties, mechanical StressStress is defined as a level of force applied on a sample with a well-defined cross section. (Stress = force/area). Samples having a circular or rectangular cross section can be compressed or stretched. Elastic materials like rubber can be stretched up to 5 to 10 times their original length.stress and the tackifier used.
A tackifier is a mixture which is applied to the tire cord surface to tailor the adhesive strength between the rubber compound and the tire cord. During the use of a tire, tensile, shear and compression StressStress is defined as a level of force applied on a sample with a well-defined cross section. (Stress = force/area). Samples having a circular or rectangular cross section can be compressed or stretched. Elastic materials like rubber can be stretched up to 5 to 10 times their original length.stress occur when the wheel rotates, as well as during braking, starting or cornering.
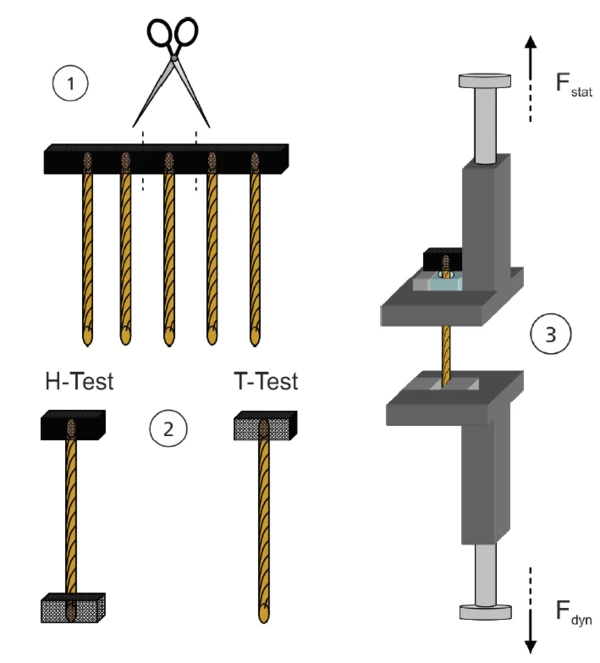
For these reasons, knowledge about the adhesion of the tire cord within the rubber matrix is essential in order to develop products with reliable and durable dynamic properties. These properties are influenced by the performance of the tackifier, which can be qualified using a high-force DMTA system such as the Eplexor® 500 N by NETZSCH GABO Instruments. Not only is the Eplexor® 500 N able to perform tensile tests based on ASTM D4776 to determine the maximum pull-out force, but it also allows for deeper insight into a materials´ properties by applying an oscillating force to the sample. Figure 1 shows the arrangement used in the so-called T-Tests or H-Tests (denomination is based on the sample´s shape) to determine the dynamic properties of embedded tire cords.
A) Temperature Influence
Figure 2 depicts a Fatigue testFatigue tests are useful tools for analyzing the lifetime behavior of materials. During fatigue tests, a dynamic oscillating load is applied onto the test specimen. fatigue test performed on two cord-rubber composites of the same material to characterize the adhesion behavior at different temperatures.
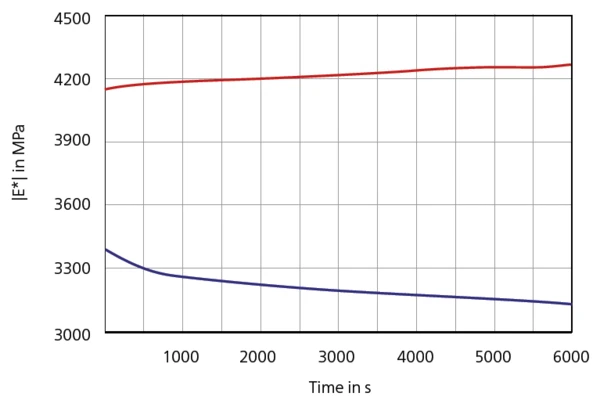
The temperature of the experiment was 100°C for sample 1 (red) and 150°C for sample 2 (blue). The test was carried out in the force-controlled mode; i.e., with a static force of 20 N and a dynamic force of 2 N. The test frequency was 60 Hz for 6000 sec (360000 cycles). The increase in the Complex ModulusThe complex modulus consists of two components, the storage and the loss moduli. The storage modulus (or Young’s modulus) describes the stiffness and the loss modulus describes the damping (or viscoelastic) behavior of the corresponding sample using the method of Dynamic Mechanical Analysis (DMA). complex modulus of sample 1 (red) can be explained as having been caused by the fact that at 100°C, the Curing (Crosslinking Reactions)Literally translated, the term “crosslinking“ means “cross networking”. In the chemical context, it is used for reactions in which molecules are linked together by introducing covalent bonds and forming three-dimensional networks.curing process proceeds. At 150°C, the Complex ModulusThe complex modulus consists of two components, the storage and the loss moduli. The storage modulus (or Young’s modulus) describes the stiffness and the loss modulus describes the damping (or viscoelastic) behavior of the corresponding sample using the method of Dynamic Mechanical Analysis (DMA). complex modulus of sample 2 (blue) decreases. This is due to the fact that the rubber compound has already begun degradation here.
Figure 3 displays the damping behavior (tanδ) of the two samples. Different temperatures result in different damping properties.
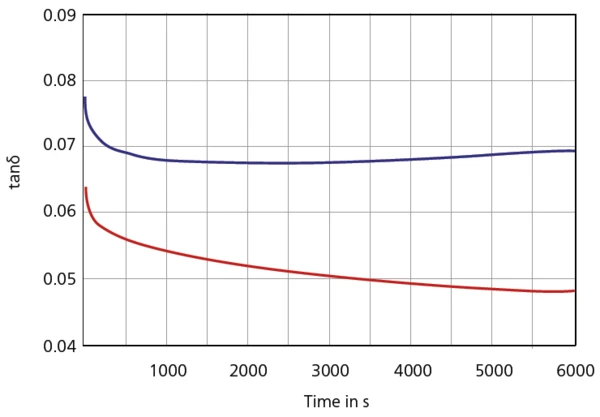
The reasons for this are the same as mentioned before. With respect to the red curve (at 100°C), tanδ decreases due to crosslinking (Curing (Crosslinking Reactions)Literally translated, the term “crosslinking“ means “cross networking”. In the chemical context, it is used for reactions in which molecules are linked together by introducing covalent bonds and forming three-dimensional networks.curing); with respect to the blue curve (at 150°C), it increases due to Decomposition reactionA decomposition reaction is a thermally induced reaction of a chemical compound forming solid and/or gaseous products. decomposition.
B) Identifying Stress Limits
Figure 4 displays the results obtained by means of analyses performed on two identical cord-rubber composites but including different tackifiers. The objective of this test was to determine the dynamic-mechanical StressStress is defined as a level of force applied on a sample with a well-defined cross section. (Stress = force/area). Samples having a circular or rectangular cross section can be compressed or stretched. Elastic materials like rubber can be stretched up to 5 to 10 times their original length.stress limits.
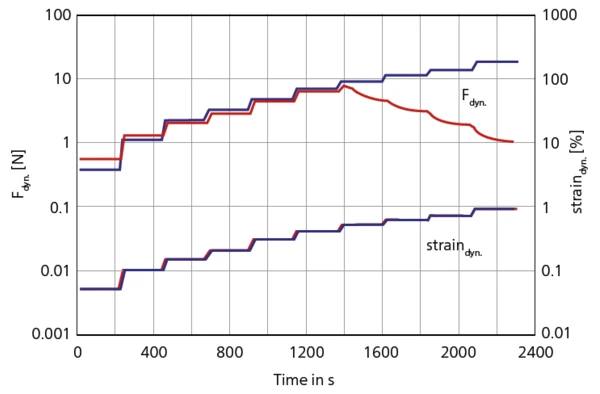
The static dynamic sweep in the StrainStrain describes a deformation of a material, which is loaded mechanically by an external force or stress. Rubber compounds show creep properties, if a static load is applied.strain-controlled mode increases in the static and dynamic StrainStrain describes a deformation of a material, which is loaded mechanically by an external force or stress. Rubber compounds show creep properties, if a static load is applied.strain step by step: 0.5% static load/0.05% dynamic StrainStrain describes a deformation of a material, which is loaded mechanically by an external force or stress. Rubber compounds show creep properties, if a static load is applied.strain; 1%/0.1%; 2%/0.2% ... 9%/0.9%.
The test frequency was 10 Hz. For every load step, 20 data points were recorded to display the expected force decline once the maximum StressStress is defined as a level of force applied on a sample with a well-defined cross section. (Stress = force/area). Samples having a circular or rectangular cross section can be compressed or stretched. Elastic materials like rubber can be stretched up to 5 to 10 times their original length.stress is reached.
The blue lines show the behavior of the cord-rubber composite with good adhesion properties, whereas the red curve originates from the material with insufficient adhesion. As can be seen from sample 1 (red curve), the tire cord already starts to pull out of the rubber matrix at 6% static StrainStrain describes a deformation of a material, which is loaded mechanically by an external force or stress. Rubber compounds show creep properties, if a static load is applied.strain and 0.6% dynamic StrainStrain describes a deformation of a material, which is loaded mechanically by an external force or stress. Rubber compounds show creep properties, if a static load is applied.strain. The 6%/0.6% stat./ dyn. load step indicates the start of the non-linear material behavior.
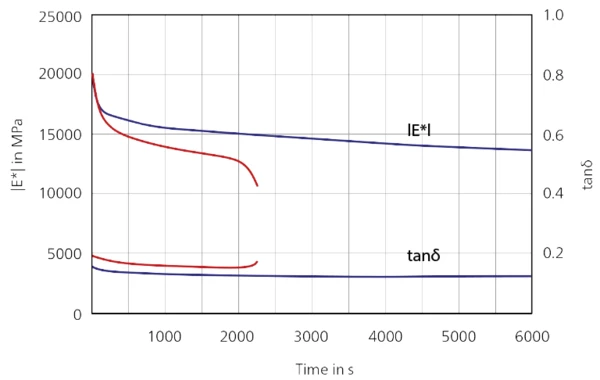
Knowing the StressStress is defined as a level of force applied on a sample with a well-defined cross section. (Stress = force/area). Samples having a circular or rectangular cross section can be compressed or stretched. Elastic materials like rubber can be stretched up to 5 to 10 times their original length.stress limits, further tests can be carried out to obtain more information on the material. Figure 5 depicts the time dependence of the Complex ModulusThe complex modulus consists of two components, the storage and the loss moduli. The storage modulus (or Young’s modulus) describes the stiffness and the loss modulus describes the damping (or viscoelastic) behavior of the corresponding sample using the method of Dynamic Mechanical Analysis (DMA). complex modulus and tanδ during a Fatigue testFatigue tests are useful tools for analyzing the lifetime behavior of materials. During fatigue tests, a dynamic oscillating load is applied onto the test specimen. fatigue test applied to the same samples as used in figure 2.
The test was carried out in the StrainStrain describes a deformation of a material, which is loaded mechanically by an external force or stress. Rubber compounds show creep properties, if a static load is applied.strain-controlled mode at a static load of 5% and a dynamic load of 0.5% at a frequency of 50 Hz. The conditions were selected so as to be close to the failure limit of 6%/0.6% derived from figure 4, with the objective of inducing a quick degradation of sample 1. The test was carried out at room temperature.
Figure 5 shows the expected results. The mechanical aging of sample 1 (red) takes place faster than that of sample 2 (blue). After 2300 sec (115000 cycles), the cord of sample 1 starts to pull out of the rubber compound, which can be seen as a decreasing Complex ModulusThe complex modulus consists of two components, the storage and the loss moduli. The storage modulus (or Young’s modulus) describes the stiffness and the loss modulus describes the damping (or viscoelastic) behavior of the corresponding sample using the method of Dynamic Mechanical Analysis (DMA). complex modulus E*.
The Complex ModulusThe complex modulus consists of two components, the storage and the loss moduli. The storage modulus (or Young’s modulus) describes the stiffness and the loss modulus describes the damping (or viscoelastic) behavior of the corresponding sample using the method of Dynamic Mechanical Analysis (DMA). complex modulus of sample 2 (blue) decreases only slowly during the measurement.
Conclusion
Continuous dynamic load tests (fatigue tests) are suited for characterizing the adhesion between the cord and rubber matrix when tackifiers are applied to the cord surface. Due to the high forces and amplitudes required, the Eplexor® instrument series by NETZSCH GABO Instruments, in particular the Eplexor® 500 N, is well suited for loading the samples dynamically for thousands of cycles. For the analyses, samples in T or H shape were used; these consisted of one tire cord each and rubber material at either one end (T-Test) or on both ends (H-Test).