Introduction
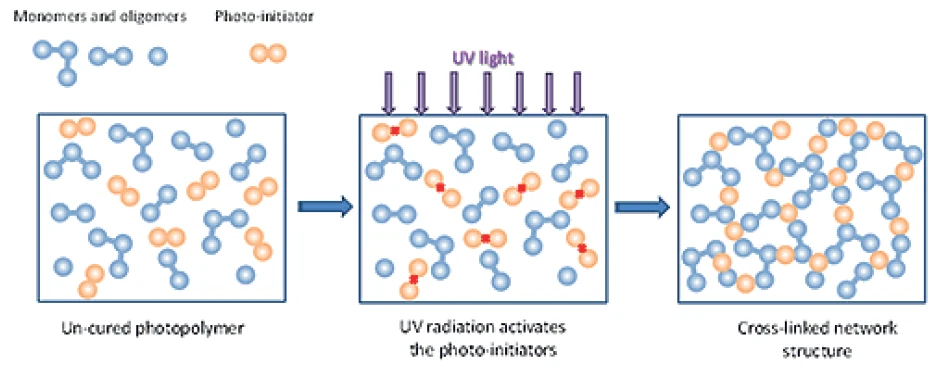
A photopolymer usually consists of monomers, oligomers and photo-initiators which cross-link to form a network structure when exposed to light, often in the ultraviolet or visible region of the electromagnetic spectrum (see Figure 1). Photo-curing is a relatively rapid process compared to thermal curing and therefore, the process can be used for selective curing using high-energy light sources, which makes the process suitable for printing circuit boards and fabricating microchips. Photo-polymers are widely used in medical, 3D-printing, coating, adhesive and proto-resist technologies [1].
Rheological measurements are commonly used to characterize the progression of visco-elastic properties of photopolymers during photo-curing. By measuring the change in complex modulus (G*), it is possible to estimate the rate of cross-linking. In addition, photopolymers tend to show significant post-cure shrinkage depending on the monomer concentration. Normal force control capability on the rheometer allows the vertical shrinkage to be measured during curing from the change in gap under a constant applied force. This can be used to calculate the percentage of post-cure shrinkage. Cross-linking kinetics of photopolymers tend to have a very strong dependency on the intensity of the UV light and the length of exposure time. It is also important to bear in mind that the intensity of the light beam reduces with the distance from the irradiative surface.

Experimental
- Rate of cross-linking and post-cure shrinkage of two different UV-curable adhesives were evaluated and compared under recommended process conditions.
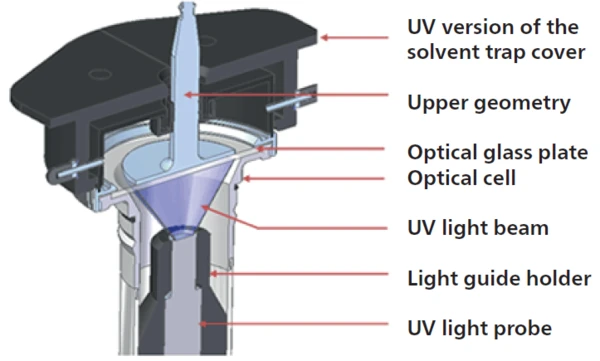
- Rotational rheometer measurements were made using Kinexus rotational rheometer with UV accessory which are attached to a cylinder cartridge. Liquid adhesive was dispensed on to a quartz glass plate through which UV light was irradiated (see Figure 2). A disposable parallel plate measuring system was used for rheology measurements.
- Thickness of the sample was 0.65 mm and a single frequency oscillatory measurement was carried out under a control StrainStrain describes a deformation of a material, which is loaded mechanically by an external force or stress. Rubber compounds show creep properties, if a static load is applied.strain of 0.1% at 1 Hz.
- A standard loading sequence was used to ensure that both samples were subjected to a consistent and controllable loading protocol.
- OmniCure® Series 2000 UV/Visible Spot Curing Unit was used with an 8 mm diameter OmniCure® liquid light guide to illuminate the sample with UV light. Wavelength of the light source covers 320 nm – 500 nm. The curing unit was used in calibration mode and OmniCure® R2000 radiometer was used to calibrate the UV output intensity.

- rSpace software is configured to communicate with OmniCure® S2000 Curing Unit via RS232 connection and output intensity can be controlled by running a standard pre-configured sequence in the software1. UV intensity of 0.5 W/cm2 was used for curing tests.
- All rheological measurements were performed at 25°C and the distance between the glass plate and the end of the light guide was kept the same.
- A constant 0 N normal force was controlled on the sample to allow free movement along the vertical axis due to the shrinkage within the sample as the crosslinking progresses.
- The OmniCure® S2000 was controlled via rSpace software, so rheological parameters-of-interest could be recorded along with the UV intensity profiles.
Results and Discussion
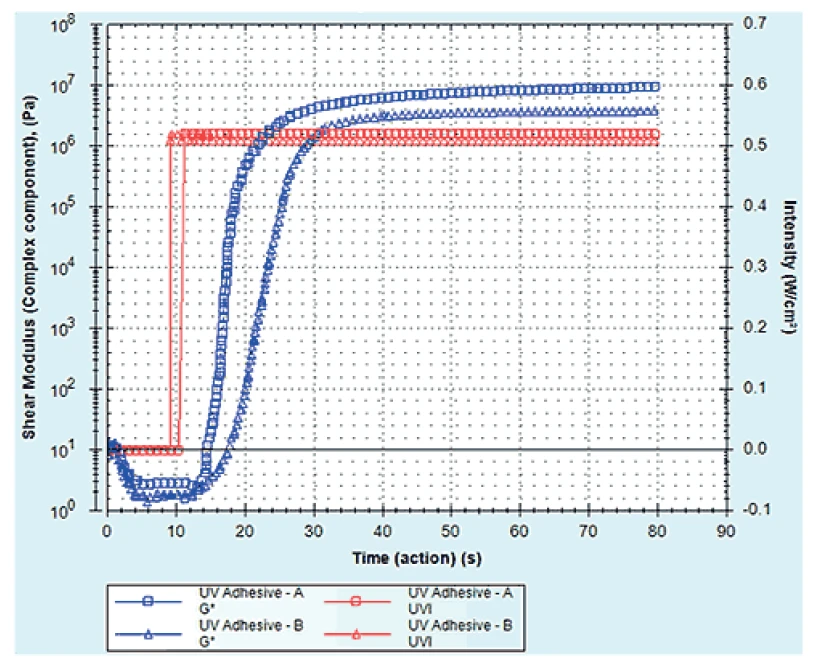
Figure 3 shows qualitative comparison of cross-linking kinetics of two different typical UV adhesives which are used in optical applications. Due to the speed of the UV reaction, the complex shear modulus (G*) rises rapidly after the UV shutter is opened. Although the complex modulus of pre-cured adhesives are similar, the rate of cross-linking is significantly different. Adhesive – B shows a lower modulus in the plateau region than Adhesive - A indicating that the cross-linking density and corresponding stiffness attainable at the end of cure with set irradiation level of 0.5 W/cm2 is lower than for Adhesive - A.

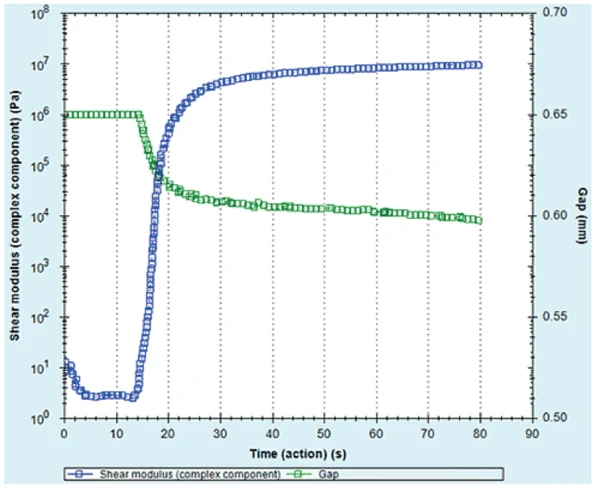
For many UV adhesives, the shrinkage due to crosslinking is one of the key parameters, which decides the performance acceptance for end-use applications. Figure 4 shows shrinkage data for Adhesive-A measured under constant normal force. rSpace software has been designed to handle this shrinkage by allowing the user to choose control the gap in auto-tension mode at a preselected normal force. Gap setting mode was used to load the sample; however, during the curing test a zero normal force was applied allowing free movement of the plate as the sample contracts. Based on the results in Figure 4, Adhesive – A shows shrinkage of 8% towards the end of the cure.

Conclusion
This application note shows how in-situ characterization of rheological properties of UV curable materials can be performed on a Kinexus rotational rheometer with UV curing accessory. From such measurements, the rate of cross-linking, and post-cure shrinkage can be followed.