Introduction
Tack or TackinessTackiness describes the interaction between 2 layers of identical (autohesion) or different (cohesion) materials in terms of surface stickiness.tackiness in the context of material behavior is associated with stickiness and may result from adhesive forces between two materials in contact or cohesive forces in a material bridging two substrates.
For pressure sensitive adhesives including tapes and labels, tack is defined as the ability to form an adhesive bond to a substrate under slight pressure and brief contact and is an essential requirement for such products. For other materials and applications, tack may be an unwanted property, an example being bone cements, which according to ISO5833 [3] must be tack-free, to allow the user to shape and apply the cement without adhering to gloves or application aids.
Tack may also influence the behavior and perception of consumer products, examples being the extrusion of thick viscoelastic products such as toothpaste from tubes or chewing or handling of sticky foods. It may also be used to assess the properties of a surface and judge whether it is clean or not. Therefore, qualitative assessment of tack can be made simply through touch or feel, however, such assessments are subjective, difficult to quantify and may be influenced by other additional factors.
For many research and development activities, it can be useful to screen, compare and quantify ‘tack’ or ‘stickiness’ using a simple objective test. For the adhesives industry, there are many such standard tests available depending on the product type, including tests such as loop tack, quick stick and rolling ball tests.
Inverted Probe Test
This application note relates to another test which is commonly used in the adhesives industry, known as the inverted probe test. In this test, an inverted probe is brought in to contact with the adhesive at a fixed speed, contact pressure and contact time. The tack is then recorded as the maximum force required to break the resultant bond.

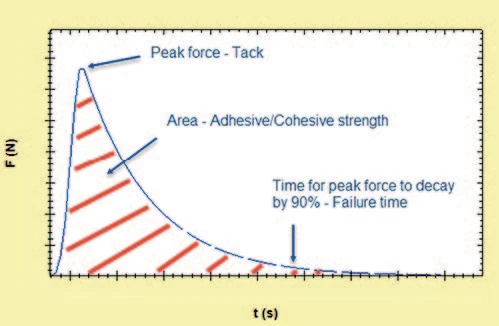
Here, the peak in negative normal force (tension) can be attributed to ‘tack’, the area under the force-time curve to adhesive or cohesive strength and the time taken for the peak force to decay by 90% a comparative measure of failure rate or time as illustrated in Figure 1.
Experimental
- Tack properties of Blu-Tack® were measured using a range of contact forces (5 N, 10 N, 15 N and 20 N).
- Measurements were made using a Kinexus rotational rheometer with a Peltier plate cartridge using a 20 mm upper plate and 65 mm lower plate (stainless steel) and standard pre-configured sequence in the rSpace software.
- A 1.3 g ball of sample was placed in the center of the lower plate with no pressure applied and the upper plate brought in to contact with the sample at an approach speed of 10 mm/s until required contact force was attained.
- Following a contact period of 2 seconds the gap was increased linearly at 10mm/s and the normal force recorded as a function of time.
- All measurements were performed at 25°C.


Results and Discussion
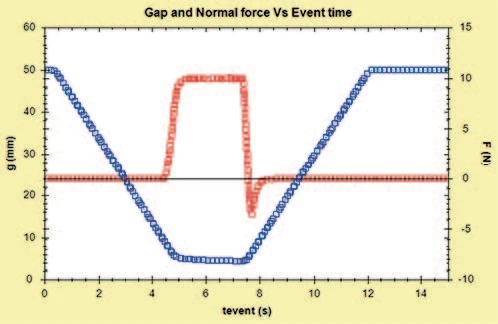
A gap and normal force profile for the Blu-Tack® with 10 N normal force applied is shown in Figure 2. This shows the approach of the upper plate to the sample at 10 mm/s and the rise in normal force as contact is made. Following a contact period of 2 s, the gap is increased linearly at 10 mm/s, corresponding with a reduction in compressive force but a residual tensile force corresponding with tack and adhesion.
Table 1: Analysis results based on Figure 3 for different contact pressures
| Sample description | Action name | Time (action) (s) | Normal force (N) | Gap (mm) | Area result |
|---|---|---|---|---|---|
| 5 N | Peak normal force | 0.3573 | -1.677 | 7.8614 | |
| 5 N | Time for force to reduce by 90% of peak | 0.7006 | -1.677 | 11.288 | |
| 5 N | Area under force time curve (N/s) |
|
| 0.4799 | |
| 10 N | Peak normal force | 0.3525 | -3.492 | 6.6156 | |
| 10 N | Time for force to reduce by 90% of peak | 0.6906 | -0.3492 | 9.9909 | |
| 10 N | Area under force time curve (N/s) | 0.8353 | |||
| 15 N | Peak normal force | 0.3690 | -4.220 | 6.0800 | |
| 15 N | Time for force to reduce by 90% of peak | 0.7127 | -0.4220 | 9.5118 | |
| 15 N | Area under force time curve (N/s) | 1.977 | |||
| 20 N | Peak normal force | 0.3105 | -5.363 | 5.2124 | |
| 20 N | Time for force to reduce by 90% of peak | 0.6522 | -0.5363 | 8.6237 | |
| 20 N | Area under force time curve (N/s) | 1.280 |
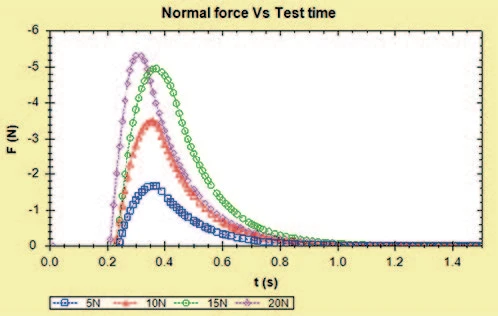
Comparative results for the different contact pressures are shown in Figure 3 and Table 1. These results relate only to the tensile (negative) force, which corresponds with tack and adhesion.
The results show that residual tension or tack increases with applied normal force, particularly up to 15 N, with only a slight incremental increase observed with 20 N applied normal force. In terms of the area under the curves, which relates to the adhesive/cohesive strength of the material, this appears to increase with contact force up to 15 N and then a decrease at 20 N is observed, indicating that there is an optimum contact force between 10 N and 20 N that gives maximum adhesion under these conditions.
The times for the normal force to decay by 90% of their peak values are similar for contact forces of 5 N, 10 N and 15 N but slightly lower for 20 N suggesting a slightly quicker failure rate after 20 N of pressure.
Conclusion
A Kinexus rotational rheometer with advanced axial test capabilities can be used to assess the TackinessTackiness describes the interaction between 2 layers of identical (autohesion) or different (cohesion) materials in terms of surface stickiness.tackiness or cohesive/adhesive properties of pressure sensitive adhesives. In this study, such properties were assessed and compared for a sample of Blu-Tack® with different contact forces. This suggests there is an optimum pressure between 10 N and 20 N which gives maximum adhesion under the conditions of the test.