はじめに
材料の挙動におけるねばり(粘着性)は、粘着性に関連しており、接触している2つの材料間の接着力、または2つの基材を橋渡しする材料の凝集力から生じる可能性があります。
テープやラベルを含む感圧接着剤では、タックはわずかな圧力と短時間の接触で基材に接着結合を形成する能力として定義され、このような製品にとって不可欠な要件である。例えば、ISO5833 [3]によれば、骨セメントはタックフリーでなければならず、手袋や塗布補助具に付着することなくセメントの形状を整え、塗布することができる。
タックはまた、消費者製品の行動や知覚に影響を与える可能性があり、その例としては、チューブから歯磨き粉のような厚い粘弾性製品を押し出したり、粘着性のある食品を噛んだり取り扱ったりすることが挙げられる。また、表面の特性を評価し、清潔かどうかを判断するために使用されることもある。したがって、タックの定性的な評価は、単に触ったり感じたりすることで行うことができるが、そのような評価は主観的であり、定量化することが難しく、他の追加的な要因の影響を受ける可能性がある。
多くの研究開発活動では、簡単な客観的試験で「タック」や「粘着性」をスクリーニング、比較、定量化することが有用です。接着剤業界では、ループタック試験、クイックスティック試験、ローリングボール試験など、製品の種類に応じて多くの標準試験が用意されています。
逆プローブ試験
このアプリケーションノートは、接着剤業界で一般的に使用されている、倒立プローブ試験として知られる別の試験に関するものです。この試験では、一定の速度、接触圧力、接触時間で、倒立したプローブを接着剤に接触させます。その結果、接着を破壊するのに必要な最大力がタックとして記録される。
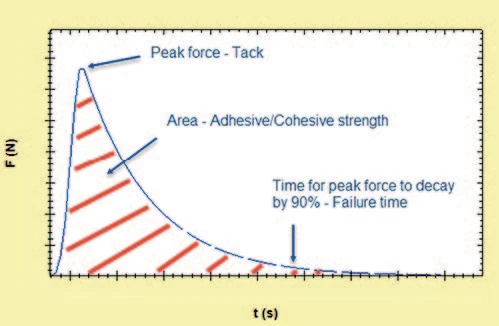
ここで、負の法線力(張力)のピークは「タック」に起因し、力-時間曲線下の面積は接着力または凝集力に起因し、ピーク力が90%減衰するまでの時間は、図1に示されるように、破損率または破損時間の比較指標となる。
実験的
- Blu-Tack®のタック特性は、さまざまな接触力(5N、10N、15N、20N)を用いて測定しました。
- 測定は、20 mmの上部プレートと65 mmの下部プレート(ステンレス鋼)を使用したペルチェプレートカートリッジ付きKinexus回転型レオメーターを使用し、rSpace ソフトウェアにあらかじめ設定された標準シーケンスで行いました。
- 1.3gの試料球を下プレート中央に無圧で置き、上プレートを10mm/sの接近速度で、必要な接触力に達するまで試料に接触させた。
- 2秒間の接触後、ギャップを10mm/sで直線的に増加させ、法線力を時間の関数として記録した。
- 測定はすべて25℃で行った。
結果と考察
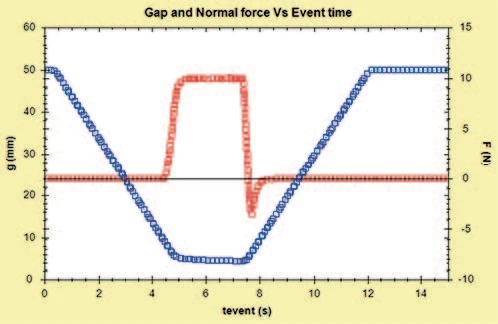
10Nの法線力を加えたBlu-Tack®のギャップと法線力のプロファイルを図2に示します。これは、10 mm/sでの上部プレートの試料への接近と、接触に伴う法線力の上昇を示している。2秒間の接触後、ギャップは10mm/sで直線的に増加し、圧縮力の減少に対応するが、タックと接着に対応する引張力が残存する。
表1:接触圧を変えた場合の図3に基づく分析結果
| 試料名 | 動作名 | 時間(動作) (s) | 法線力 (N) | 隙間 (mm) | 面積結果 |
|---|---|---|---|---|---|
| 5 N | ピーク法線力 | 0.3573 | -1.677 | 7.8614 | |
| 5 N | 力がピークの90%まで減少する時間 | 0.7006 | -1.677 | 11.288 | |
| 5 N | 力時間曲線下面積(N/s) | 0.4799 | |||
| 10 N | ピーク法線力 | 0.3525 | -3.492 | 6.6156 | |
| 10 N | 力がピークの90%まで減少する時間 | 0.6906 | -0.3492 | 9.9909 | |
| 10 N | 力時間曲線下面積 (N/s) | 0.8353 | |||
| 15 N | ピーク法線力 | 0.3690 | -4.220 | 6.0800 | |
| 15 N | 力がピークの90%まで減少する時間 | 0.7127 | -0.4220 | 9.5118 | |
| 15 N | 力時間曲線下面積(N/s) | 1.977 | |||
| 20 N | ピーク法線力 | 0.3105 | -5.363 | 5.2124 | |
| 20 N | 力がピークの90%まで減少する時間 | 0.6522 | -0.5363 | 8.6237 | |
| 20 N | 力時間曲線下面積(N/s) | 1.280 |
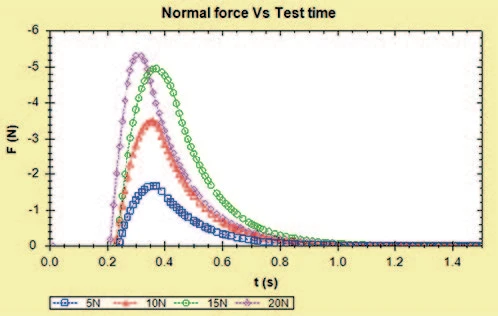
異なる接触圧の比較結果を図3と表1に示す。これらの結果は、タックと接着に対応する引張(負)力のみに関するものである。
この結果から、残留張力またはタックは、特に15Nまでは、加えられた法線力とともに増加し、20Nではわずかな増加が観察されるだけであることがわかる。材料の接着力/粘着力に関連する曲線下面積に関しては、15Nまでは接触力とともに増加し、20Nで減少が観察された。このことは、これらの条件下で最大の接着力を与える最適な接触力が10Nと20Nの間に存在することを示している。
法線力がピーク値の90%まで減衰するまでの時間は、接触力5N、10N、15Nではほぼ同じであるが、20Nではわずかに低くなっている。
結論
高度な軸方向試験機能を備えたKinexus回転型レオメーターを使用して、感圧接着剤のねばり(粘着性)または凝集/接着特性を評価することができます。この研究では、Blu-Tack®の試料について、接触力を変えてこのような特性を評価し、比較しました。このことは、試験の条件下で最大の粘着力を与える最適な圧力が10Nと20Nの間にあることを示唆している。