Application from the Pharmaceutical Field
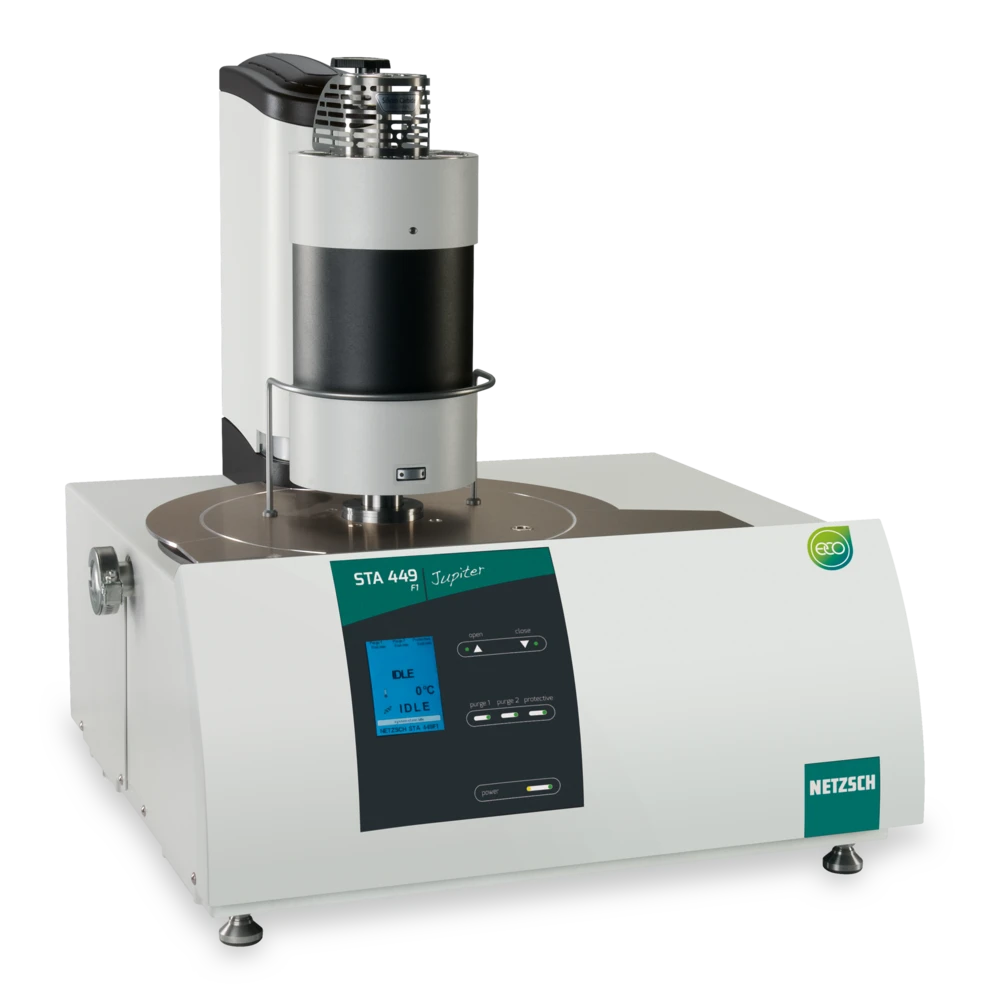
Thermogravimetry (TG) or thermogravimetric analysis (TGA) is an established method for compositional analysis, e.g., for detecting the water content of hydrates [1]. The measurement of the residual mass during a TGA experiment can serve for calculating, for example, the filler content of polymer compounds or composites [2, 3]. A more difficult application is the determination of small amounts of non-evaporating impurities being present in liquid, evaporating solvents such as acetone, ethanol or water. This technique – where the residual mass can be viewed as distillation residue – was applied by J. Wiss et al. using a NETZSCH STA 449 F1 Jupiter® (see figure 1) in order to validate the cleaning of the equipment of pharmaceutical production plants [4]. The authors demonstrated that impurities with various concentrations in the range between about 5 and 50 ppm could be reliably detected [4].
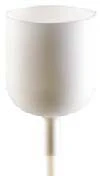
An impurity mass concentration of, for example, 5 ppm required the detection of a residual mass as small as 25 μg after the evaporation of the solvent with a mass of 5 g, which is the maximum load capacity and at the same time the maximum dynamic weighing range of the STA 449 F1 Jupiter®. Measurements of such large samples are possible since this instrument can be equipped with a TGA sample carrier and a beaker crucible with a volume of 5 cm3 as shown in figure 2. Nevertheless, a mass concentration of only 5 ppm is a very small amount. It can be illustrated by a little bird with a mass of 10 g sitting on the back of a young elephant with a mass of 2000 kg.
Let’s Weigh the Little Bird
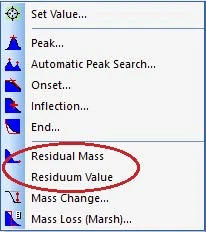
In general, the Proteus® analysis software by NETZSCH, which works also in the framework of the CFR21 Part 11 conform software Proteus® Protect, offers two possibilities for the calculation of the residual mass from a TG curve (see figure 3). The first is the standard functionality “Residual Mass”, which is calculated as follows:
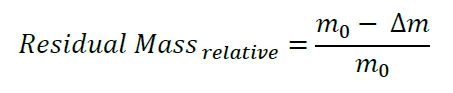
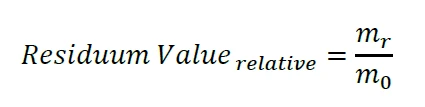
where m0 is the initial sample mass and Δm is the entire mass loss measured during the TGA experiment. The Residual Mass function works well for typical values in the percent range. For much smaller residual masses, however, m0 and Δm are almost identical and, in addition, both values have to be relatively large (in the range of a few grams, see above). Especially for liquid and strongly volatile samples, the determination of both, m0 and Δm, via thermogravimetry is just not accurate enough for a reliable calculation of (m0 – Δm) in the range of a few micrograms. Getting back to our illustration above, it makes no sense to measure the mass of the elephant together with the little bird and subtract the mass of the elephant alone in order to obtain the mass of the little bird. A better approach is to measure the mass of the little bird separately. Thanks to the second functionality “Residuum Value”, we are able to detect the absolute mass signal mr at the end of the TGA experiment – which corresponds exactly to the mass of the little bird:
Prerequisite for the evaluation of the highly accurate Residuum Value is that the measurement starts with a so-called Initial Standby, where the sample is inserted, and ends with a Final Standby, where the Residuum Value is determined. The (IsothermalTests at controlled and constant temperature are called isothermal.isothermal) temperatures and gas flow conditions must be the same during both Standby phases. Further details can be found in the help system of the Proteus® software. Another prerequisite for accurate and reproducible results is, of course, the low drift of the thermobalance used: The NETZSCH STA 449 F1 Jupiter® has a long-time balance drift of less than 1 μg per hour.
Experimental Results
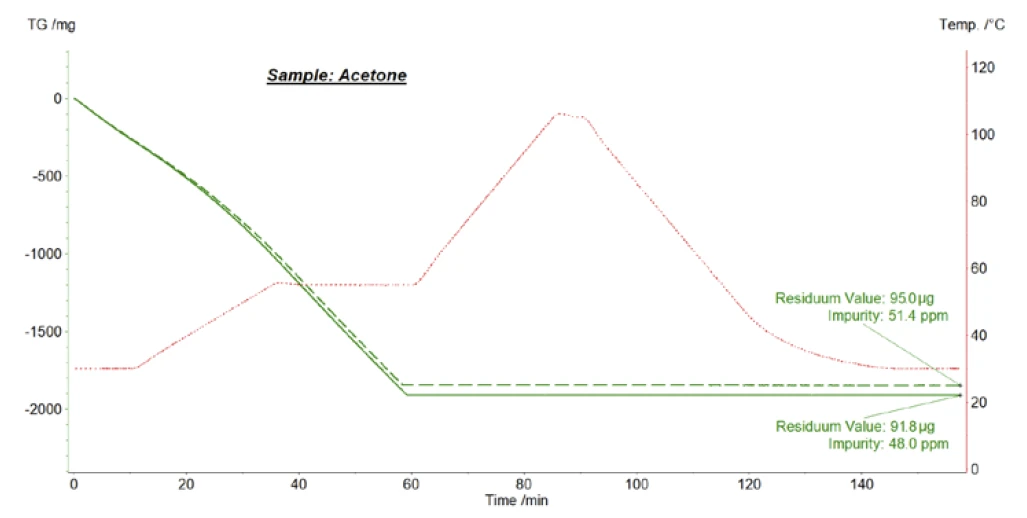
Figure 4 depicts exemplary measurement results obtained for commercially available acetone solvent. The NETZSCH STA 449 F1 Jupiter® thermal analyzer equipped with a TGA sample carrier and Al2O3 beaker crucible was applied for these tests; helium at a flow rate of 70 ml/min was used as a purge gas. The furnace temperature program shown in figure 4 is exactly the same as the one used by J. Wiss et al. [4]: Upon heating to 50°C and during the IsothermalTests at controlled and constant temperature are called isothermal.isothermal segment at 50°C, the acetone solvent evaporated completely, which can be seen from the mass loss of about 1900 mg observed for each measurement. After that, the furnace was heated to 105°C and finally cooled back to the initial temperature of 30°C. From the Residuum Values of 95 μg and 92 μg measured automatically at the end of the IsothermalTests at controlled and constant temperature are called isothermal.isothermal phase at 30°C, and the initial sample masses of 1848 mg and 1913 mg determined automatically at the start of the measurements, mass concentrations of 51 ppm and 48 ppm of non-evaporating impurities were calculated by the Proteus® analysis software.
Summary
These results demonstrate the use of the NETZSCH STA 449 F1 Jupiter® in combination with its intelligent Proteus® software for accurate determination of impurities in solvents down to the ppm level. This application was investigated extensively for a validation of the cleaning of the equipment of pharmaceutical production plants [4].