Introduction
The rheological properties of materials help understand and anticipate their behavior during the process. For example, they play a role in the lubrication ability, pumpability, flow (yield) point of lubricating greases.
Measurement Conditions
In the following, the shear viscosity of a lubricating grease is determined with the Kinexus pro+ under the measurement conditions described in the DIN 51810-1 standard. Table 1 and figure 1 summarize the test parameters specified in this standard.
Table 1: Measurement conditions
| Geometry | CP/25 (cone-plate system, cone angle: 1°, plate diameter: 25 mm) | |
|---|---|---|
| Temperature | 25°C (±0.1°C) | |
| Measurement gap | 24 μm | |
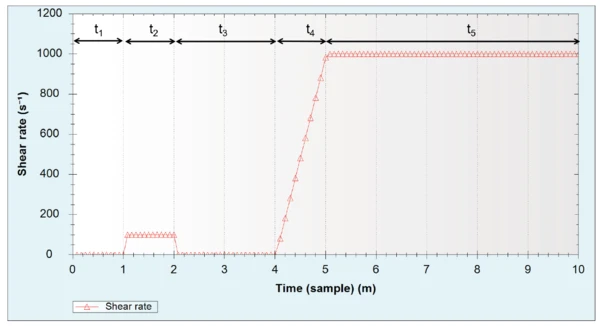
| Measurement program | Phase t1: 1 min at rest, 0 Pa | |
Phase t2: 1 min pre-shear, 100 s-1 | ||
Phase t3: 2 min at rest, 0 Pa | ||
Phase t4: Linear increase in shear rate from 0 to 1000 s-1 in 1 min | ||
Phase t5: 5 min at a constant shear rate (1000 s-1) | ||
Measurement Results
The torque required for each applied shear rate is measured which is automatically converted by the rSpace software to determine the shear StressStress is defined as a level of force applied on a sample with a well-defined cross section. (Stress = force/area). Samples having a circular or rectangular cross section can be compressed or stretched. Elastic materials like rubber can be stretched up to 5 to 10 times their original length.stress. The shear rate and shear StressStress is defined as a level of force applied on a sample with a well-defined cross section. (Stress = force/area). Samples having a circular or rectangular cross section can be compressed or stretched. Elastic materials like rubber can be stretched up to 5 to 10 times their original length.stress are then used in the calculation of the shear viscosity using the equation as follows:
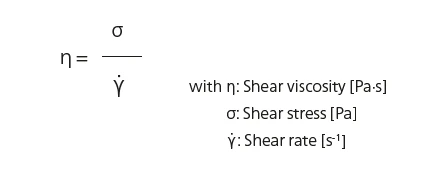
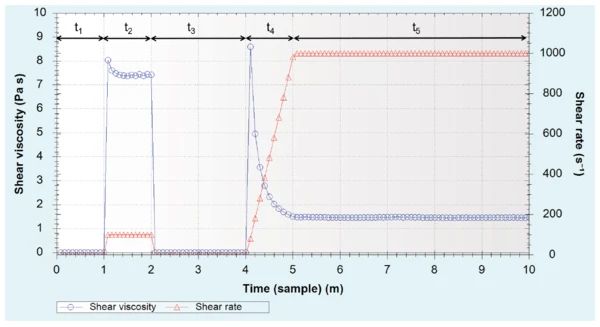
Figure 2 displays the applied shear rate (orange curve) and the resulting shear viscosity (blue curve). As expected, the shear viscosity amounts to zero when no shear StressStress is defined as a level of force applied on a sample with a well-defined cross section. (Stress = force/area). Samples having a circular or rectangular cross section can be compressed or stretched. Elastic materials like rubber can be stretched up to 5 to 10 times their original length.stress is applied (phase t1). An increase in shear rate to 100 s-1 leads to a measured increase in shear viscosity to 7.5 Pa·s (phase t2). The response of the sample to the following cessation of any deformation is an immediate return of the shear viscosity to effectively zero (phase t3). The linear increase in shear rate (phase t4) highlights the structured and Shear ThinningThe most common type of non-Newtonian behavior is shear thinning or pseudoplastic flow, where the fluid viscosity decreases with increasing shear.shear-thinning behavior of the lubricating grease: The shear viscosity generally decreases with increased shear rate. The reaction of the material to the following constant shear rate at 1000 s-1 (phase t5) is of utmost importance because it shows if the shear viscosity remains stable when subjected to a high constant shear rate; and, if it doesn´t remain stable, how strong it changes under a consistent, and high deformation rate.
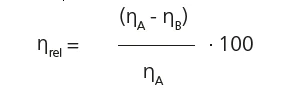
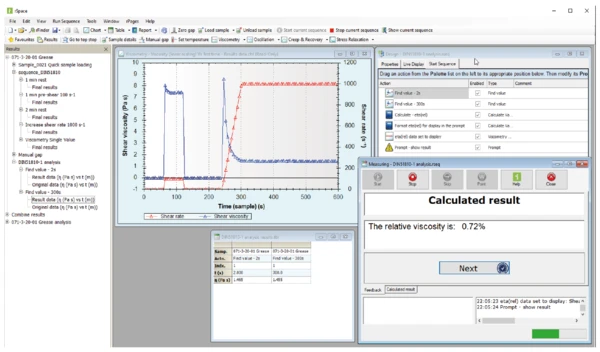
DIN 51018-1 standard indicates how to quantify this change in shear viscosity ηrel during the last step. For that, the shear viscosity at 2 s (ηA) and at 300 s (ηB) after the start of the fifth phase as well as the relative viscosity change between both values are reported. The relative viscosity change is defined as:
The powerful rSpace software used for the measurements and the evaluation is capable to automatically calculate these parameters. Figure 3 shows the table extracted from the rSpace software with the required values of the shear viscosity at 2 s and 300 s and the resulting relative viscosity change ηrel of 0.7%. This low value of less than 1% indicates that the sample adapts very quickly to the applied shear rate.
Conclusion
A lubricating grease was measured under the conditions described in DIN 51810-1. Evaluation was successfully carried out automatically thanks to an analysis that can even be included in the measuring method for easy and fast execution of the measurements with the objective of user-independent determination of the results.