POLYMERS
Quality Control of Polymers by means of DSC - Incoming Goods Inspection
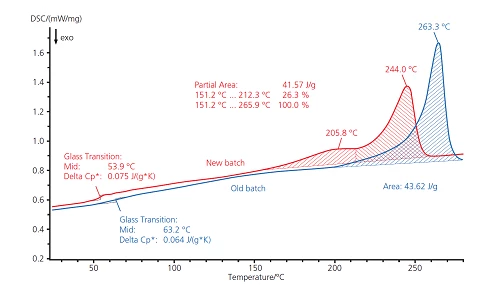
The plot shows the DSC results for two seemingly identical granulate batches, specified as Polyamide 66, which were delivered at different times (2nd heating after controlled cooling at 20 K/min).
The blue curve (old batch) shows the Glass Transition TemperatureThe glass transition is one of the most important properties of amorphous and semi-crystalline materials, e.g., inorganic glasses, amorphous metals, polymers, pharmaceuticals and food ingredients, etc., and describes the temperature region where the mechanical properties of the materials change from hard and brittle to more soft, deformable or rubbery.glass transition at 63°C (mid-point) and the melting peak at 263°C, which are both typical for PA66. The new batch (red curve), however, exhibits a double peak with peak temperatures at 206°C and 244°C. This indicates that the new granulate most probably contains a second polymer which blends with PA66.