Introduction
Differential scanning calorimetry (DSC) is a popular method to characterize thermal effects as melting, crystallization or Temperatura de Transición VítreaThe glass transition is one of the most important properties of amorphous and semi-crystalline materials, e.g., inorganic glasses, amorphous metals, polymers, pharmaceuticals and food ingredients, etc., and describes the temperature region where the mechanical properties of the materials change from hard and brittle to more soft, deformable or rubbery.glass transition and many more.
The DSC signal is proportional to the Specific Heat Capacity (cp)Heat capacity is a material-specific physical quantity, determined by the amount of heat supplied to specimen, divided by the resulting temperature increase. The specific heat capacity is related to a unit mass of the specimen.specific heat capacity of the material being measured, and also to the heating rate and the sample mass. The Specific Heat Capacity (cp)Heat capacity is a material-specific physical quantity, determined by the amount of heat supplied to specimen, divided by the resulting temperature increase. The specific heat capacity is related to a unit mass of the specimen.specific heat capacity is a material size and can therefore not be changed. The glass transition is a change in Specific Heat Capacity (cp)Heat capacity is a material-specific physical quantity, determined by the amount of heat supplied to specimen, divided by the resulting temperature increase. The specific heat capacity is related to a unit mass of the specimen.specific heat capacity and can typically be detected as a small effect in the DSC curve. A possibility to magnify this or other small effects is to increase the sample mass. If the amount of material available is limited, using a sensitive DSC – a stable baseline proveided – allows for detecting small effects even with only a small sample quantity.
Measurement Conditions
In the following, the glass transition of polystyrene with different sample masses is determined by means of DSC. Table 1 summarizes the measurement conditions.
Table 1: Measurement conditions
| Device | DSC 300 Caliris® with H-Module | |||
| Sample mass | 10.38 mg | 1.07 mg | 131 μg | 80 μg |
| Crucible | Concavus® (aluminum, closed with pierced lid) | |||
| Temperature range | 25°C to 180°C | |||
| Heating rate | 10 K/min | |||
| Atmosphere | Nitrogen (20 ml/min) | |||
Measurement Results
Figure 1 depicts the DSC resulting curve of the 10.38-mg sample. The glass transition is detected as an endothermal step at 87.1°C (midpoint). It is related to a change in Specific Heat Capacity (cp)Heat capacity is a material-specific physical quantity, determined by the amount of heat supplied to specimen, divided by the resulting temperature increase. The specific heat capacity is related to a unit mass of the specimen.specific heat capacity of 0.3 J/(g·K).
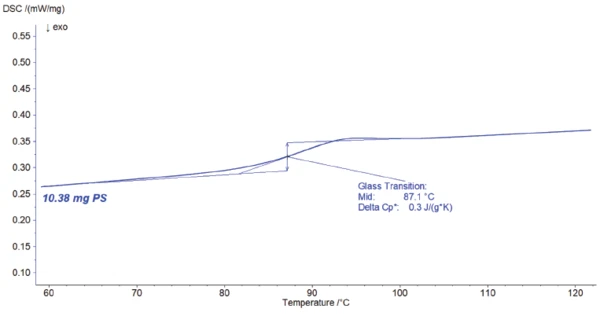
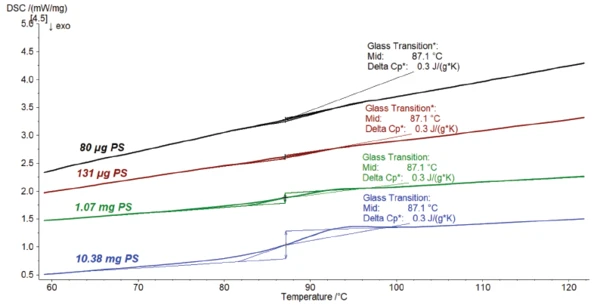
Figure 2 compares the previous measurement (blue curve) to the tests performed on lower masses. The lower the sample mass, the smaller the glass transition appears. However, it results, of course, in the same Specific Heat Capacity (cp)Heat capacity is a material-specific physical quantity, determined by the amount of heat supplied to specimen, divided by the resulting temperature increase. The specific heat capacity is related to a unit mass of the specimen.specific heat capacity change because this one is not depending on the mass.
Summary
The sensitive sensor of the DSC 300 Caliris® allows for detection of small effects even for small sample masses. Due to the larger sample mass, the glass transition effect in the DSC curve can be better recognized higher. This improves evaluation and precision of the glass transition temperature.