From the Cooling Rate to Crystallinity
Semi-crystalline polymers contain both a crystalline and an amorphous phase. Their degree of crystallinity depends on their structure: A linear polymer chain will crystallize easier than a branched polymer. Even in linear polymers made of identical monomers, there are differences in the ability to crystallize, depending on the tacticity and the molecular weight of the material. While an atactic polymer (in which the side groups are randomly set along the carbon backbone) will not crystallize and thus exists only as an amorphous material, the syndiotactic counterpart (in which the position of the side groups alternates) is capable of crystallizing at least partially and is usually a semi-crystalline material. [1, 2]
The degree of crystallization depends not only on the nature of the polymer, but also on the processing conditions, e.g., crystallization temperature and cooling rate. While very low cooling rates leave the polymer chains time enough to rearrange for building crystals called spherulites, a quenched polymer is usually amorphous, i.e., its chains are not ordered.
From Crystallinity to Polymer Properties
Is the degree of crystallinity, and thus are the processing conditions, important? The answer is yes, because the degree of crystallinity and the properties are closely related. The higher the degree of crystallinity of a semicrystalline material, the stiffer and the less hygroscopic it is, just to mention one mechanical and one chemical property.
Amorphous and Crystalline Phase: The Influence of theCooling Rate
In the following, the influence of the cooling rate on the thermal properties of a semi-crystalline polymer is investigated.
For that, eight samples were prepared from a PET granulate material and measured with the Differential Scanning Calorimeter 300 Caliris®. They were all tested in exactly the same way, except for the cooling rate.
- A first heating up to above the melting peak temperature was carried out in order to erase the thermal history of the sample.
- During cooling at different nominal cooling rates, a new thermal history was created, depending only on the cooling conditions.
- The second heating of the polymers created during cooling was compared. This yields information about the crystalline and amorphous parts of the material.
Table 1 summarizes the conditions of the measurements.
Table 1: Conditions of the DSC measurements performed on PET granulate
| Device | DSC 300 Caliris® Select, P-Module | |||||||
|---|---|---|---|---|---|---|---|---|
| Sample mass [mg] | 2.88 | 2.88 | 2.87 | 2.86 | 2.85 | 2.83 | 2.80 | 2.78 |
| Crucible | Concavus® (aluminum) with pierced lid | |||||||
| Atmosphere | Nitrogen (40 ml/min) | |||||||
| Temperature range | 0°C...275°C | |||||||
| 1st heating rate [K/min] | 10 | |||||||
| Nominal cooling rate before the 2nd heating [K/min] | 0.5 | 1 | 5 | 10 | 20 | 50 | 100 | 200 |
| 2nd heating rate [K/min] | 10 | |||||||
Typical DSC Measurement on PET
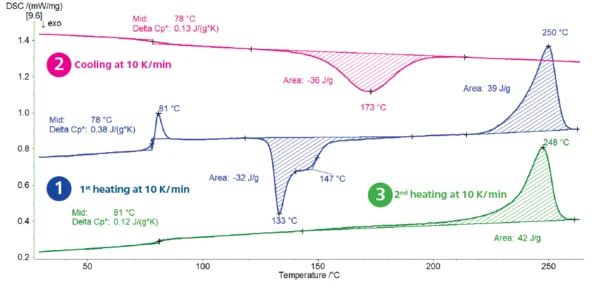
Figure 1 displays the results of the measurement carried out at a cooling rate of 10 K/min.
1st heating (blue curve): The step in the DSC curve detected at 78°C (midpoint) results from the Temperatura de Transición VítreaThe glass transition is one of the most important properties of amorphous and semi-crystalline materials, e.g., inorganic glasses, amorphous metals, polymers, pharmaceuticals and food ingredients, etc., and describes the temperature region where the mechanical properties of the materials change from hard and brittle to more soft, deformable or rubbery.glass transition of PET. It is overlapped with a RelaxationWhen a constant strain is applied to a rubber compound, the force necessary to maintain that strain is not constant but decreases with time; this behavior is known as stress relaxation. The process responsible for stress relaxation can be physical or chemical, and under normal conditions, both will occur at the same time. relaxation peak at 81°C (peak temperature) stemming from the release of mechanical tensions. The ExotérmicoA sample transition or a reaction is exothermic if heat is generated.exothermal peak with a minimum at 133°C and a shoulder at 147°C (onset temperature) is due to the cold crystallization of the material. At temperatures above the glass transition, the polymer chains can move freely and are capable of crystallizing during further heating. This behavior is typical for PET with high amorphous content. The peak detected at 250°C is due to the melting of the crystalline phase.
Cooling (pink curve): The sample crystallizes, as can be seen from the exothermal peak at 173°C (peak temperature). The step in the DSC curve with midpoint measured at 78°C is typical for the glass transition, during which PET changes from a rubbery state to a glassy state.
2nd heating (green curve): Heating above the glass transition temperature leads to a change in specific heat at 81°C. The cp change is lower than that of the first heating (0.12 vs 0.38 J/(g·K)). This means that the polymer built during cooling at 10 K/min is less amorphous than the original material. Further heating results in the melting of the crystalline phase, highlighted by the endothermal peak at 248°C (peak temperature).
From Low to High Cooling Rates
Figure 2 depicts the second heating of all measurements. For better readability, only two curves are evaluated in the plot. Table 2 details all evaluation results.
Effect of the cooling rate on the glass transition: The higher the cooling rate, the higher the glass transition step of the subsequent heating, i.e., the higher the amorphous phase formed. This is explained simply by the fact that the polymer chains don’t have time enough to crystallize during the fast cooling.
Effect of the cooling rate on the cold crystallization: No cold crystallization peak is detected for the samples cooled slowly (0.5, 1, 5 and 10 K/min) because crystallization has already taken place during cooling. For the curves corresponding to the heating between 0.5 and 200 K/min 250, 100 and 200 K/min, the enthalpy of the cold crystallization peak increases as the cooling rates of the previous cooling increase.
Effect of the cooling rate on melting: Finally, all samples melt at 247-248°C (peak temperature), except for PET that was cooled at 0.5 and 1 K/min. Here, the melting peak temperature is lower. This could be the result of a degradation process that possibly occurs for the low cooling rates because the polymer remains at high temperatures for longer. Another explanation is that PET crystallizes with two different distributions of lamella thickness, each distribution having its own Melting Temperatures and EnthalpiesThe enthalpy of fusion of a substance, also known as latent heat, is a measure of the energy input, typically heat, which is necessary to convert a substance from solid to liquid state. The melting point of a substance is the temperature at which it changes state from solid (crystalline) to liquid (isotropic melt).melting temperature [3]. Already for the measurement carried out after cooling at 5 K/min, the melting peak of PET is detected at 247°C, but it also shows a shoulder at 233°C that could be related to the crystallization of this second distribution.

Table 2: Evaluation of the heating (PET granulate)
| Nominal cooling rate | Glass transition | |||||
|---|---|---|---|---|---|---|
| Temperature | Δcp | Temperature | Enthalpy | Temperature | Enthalpy | |
| K/min | °C | J/(g•K) | °C | J/g | °C | J/g |
| 0.5 | 80 | 0.12 | - | - | 239 | 49 |
| 1 | 78 | 0.12 | - | - | 241 | 50 |
| 5 | 82 | 0.12 | - | - | 247 (233*) | 44 |
| 10 | 81 | 0.12 | - | - | 248 | 42 |
| 20 | 79 | 0.19 | 145 | 11 | 248 | 38 |
| 50 | 78 | 0.29 | 148 | 30 | 248 | 38 |
| 100 | 78 | 0.31 | 150 | 33 | 248 | 38 |
| 200 | 78 | 0.30 | 148 | 35 | 247 | 38 |
* The second figure (in parentheses) refers to the temperature of the shoulder present for the measurement obtained after a cooling rate of 5 K/min
Remark: The same experiments were performed on a different PET material, taken from a PET bottle. Table 3 summarizes the measurement conditions.
Figure 3 displays the measurement curves. It shows that the influence of the cooling rate on the crystallinity of the material is similar to that of the PET granulate. The higher the cooling rate, the higher the glass transition step and the Post Crystallization (Cold Crystallization)The post crystallization of semi-crystalline plastics occurs primarily at elevated temperatures and increased molecular mobility above the glass transition.post-crystallization peak, i.e., the higher the amorphous phase. Also, the melting peak is shifted to lower temperatures for the measurements after slow cooling, meaning there too that either different distributions of lamella thickness or a degradation process is present.
However, comparison with the previous measurements clearly demonstrates that there is not just a single PET material, but that PET of different provenance can show different thermal behavior. For example, the Post Crystallization (Cold Crystallization)The post crystallization of semi-crystalline plastics occurs primarily at elevated temperatures and increased molecular mobility above the glass transition.post-crystallization peak temperature is detected at a higher temperature for all measurements carried out on the PET bottle than for those carried out on the PET granulate.
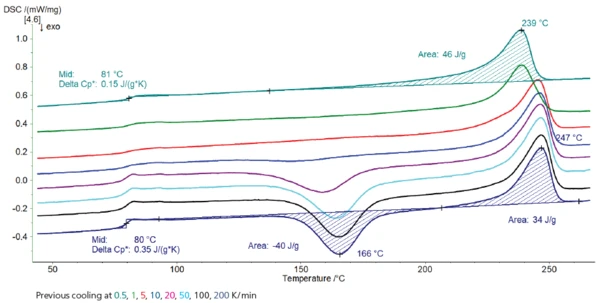
Table 3: Measurement conditions for the sample from the PET bottle
| Device | DSC 300 Caliris® Select, P-Module | |||||||
|---|---|---|---|---|---|---|---|---|
| Sample mass [mg] | 2.65 | 2.63 | 2.60 | 2.53 | 2.53 | 2.52 | 2.52 | 2.52 |
| Crucible | Concavus® (aluminum) with pierced lid | |||||||
| Atmosphere | Nitrogen (40 ml/min) | |||||||
| Temperature range | 0°C...275°C | |||||||
| 1st heating rate [K/min] | 10 | |||||||
| Nominal cooling rate before the 2nd heating [K/min] | 0.5 | 1 | 5 | 10 | 20 | 50 | 100 | 200 |
| 2nd heating rate [K/min] | 10 | |||||||
Conclusion
The influence of the cooling rate on the thermal properties of a PET material was determined by means of DSC measurements. The higher the cooling rate, the less time the polymer chains have to crystallize, and the higher the amorphous phase. This results in a higher glass transition step in the subsequent heating. By continuing heating above the glass transition, the chains present in the amorphous phase are capable of moving and rearranging to build spherulites. This results in a cold-crystallization peak, which has all the greater enthalpy as the cooling speed was high. Finally, the melting peak of the crystallized phase is shifted to a lower temperature for the slowest cooling rates. An initial explanation for this is the presence of different crystalline phases, the formation of which depends on the previous cooling rate. A second one is related to a degradation process.