Introducción
Cuando se realizan mediciones reológicas de cizallamiento en líquidos estructurados, en particular suspensiones, emulsiones o espumas, existe una alta probabilidad de que la medición se vea afectada por un fenómeno conocido como "deslizamiento de pared". El deslizamiento de la pared suele ser el resultado de un agotamiento local de la fase dispersa cerca de las paredes de la geometría, formando efectivamente una capa de lubricación en la superficie. Como consecuencia, las propiedades reológicas a granel dejan de medirse con precisión, lo que provoca una subestimación de la viscosidad real.
Un efecto similar puede observarse cuando se miden materiales similares a los sólidos en los que no hay suficiente fricción entre la muestra y la pared para soportar la tensión aplicada.
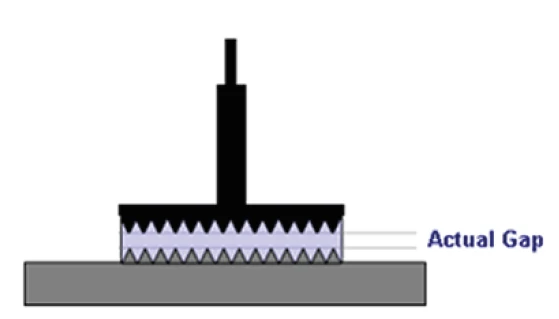
El deslizamiento de la pared puede contrarrestarse de varias maneras cuando se realizan ensayos en un reómetro rotacional, sobre todo mediante el uso de geometrías rugosas o dentadas que llevan el movimiento de la geometría a la mayor parte de la muestra y maximizan así el contacto muestra-muestra a expensas de las interacciones muestra-pared. En el caso de los sistemas de copa y bob, también pueden utilizarse geometrías de paletas y estriadas.
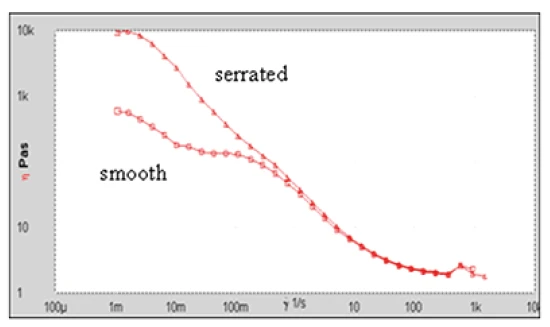
La figura 2 muestra la consecuencia del deslizamiento de una suspensión concentrada de partículas medida con placas paralelas lisas. La aparente "pata de perro" en la curva de flujo es una característica familiar del deslizamiento de la pared que, en este caso, puede eliminarse en gran medida mediante el uso de placas dentadas.
Para casos más sutiles de deslizamiento de pared, es menos fácil confirmar su presencia a menos que las mediciones se realicen con placas lisas y dentadas o rugosas, aunque en muchos casos, un usuario puede no tener ambos tipos de geometría disponibles para tal comparación.
En tales casos, pueden obtenerse pruebas de deslizamiento realizando mediciones controladas por tensión en diferentes separaciones. Si se produce deslizamiento, la velocidad de deslizamiento Vs dependerá únicamente del esfuerzo cortante aplicado σ, pero no de la separación. Por el contrario, la diferencia de velocidad a través de la muestra, que se utiliza para calcular la velocidad de cizallamiento, dependerá tanto de la separación como del esfuerzo de cizallamiento. Así pues, variando la separación h y manteniendo constante la tensión σ, es posible determinar la velocidad de deslizamiento y la velocidad de cizallamiento real utilizando la ecuación 1.
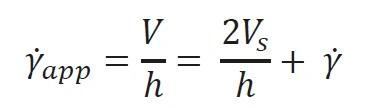
V es la velocidad de la placa superior
-γapp es la velocidad de cizalladura medida
-γ es la velocidad de cizalladura verdadera
Esto se consigue trazando la velocidad medida -γapp frente a 1/h, lo que debería dar como resultado una línea recta con gradiente 2Vs e intercepción γ-.
En algunos casos, se han observado valores negativos para la velocidad de cizallamiento real, que se han atribuido a errores de carga, precisión de la separación y propiedades del material dependientes de la separación. En consecuencia, es preferible trabajar con separaciones mayores, donde se minimizarán estos errores.
Experimental
- En este experimento se han evaluado una loción corporal y un gel de ducha para determinar el grado de deslizamiento de la pared durante una medición reológica.
- Las mediciones del reómetro rotacional se realizaron utilizando el reómetro rotacional Kinexus con un cartucho de placa Peltier y un sistema de medición de placa paralela rugosa1, y utilizando secuencias estándar preconfiguradas en el software rSpace.
- Se utilizó una secuencia de carga estándar para garantizar que ambas muestras se sometían a un protocolo de carga coherente y controlable.
- Todas las mediciones reológicas se realizaron a 25°C.
- La secuencia preconfigurada permitió realizar mediciones consecutivas en varias separaciones entre 1,2 y 0,9 mm utilizando una tensión aplicada constante de 50 Pa para la crema para la piel y de 10 Pa para el gel de ducha.
- A continuación, la velocidad de cizallamiento medida se representó automáticamente en función de la separación inversa y se ajustó un modelo de regresión lineal. La velocidad de deslizamiento y la velocidad de cizallamiento real se estimaron a partir del gradiente y el intercepto, respectivamente.
Resultados y debate
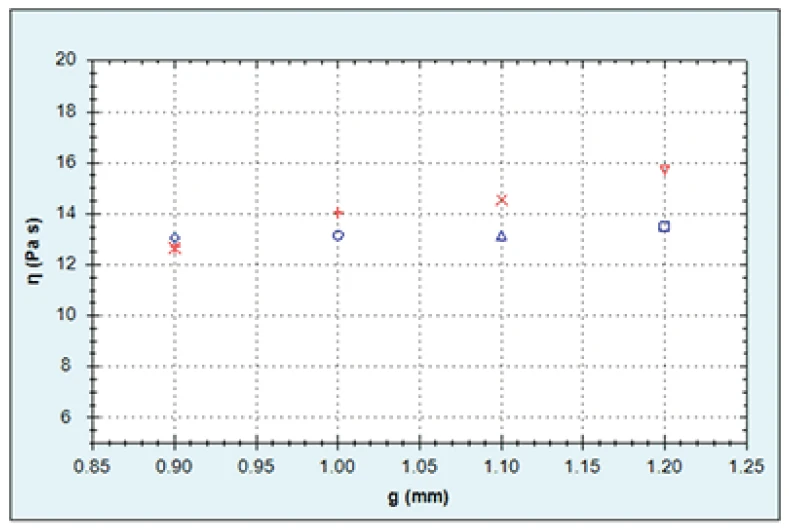
La figura 3 muestra gráficos de viscosidad de cizallamiento en función de la separación. Mientras que el gel de ducha muestra una viscosidad relativamente constante en cada intersticio, la crema para la piel muestra un ligero gradiente con viscosidades más bajas en los intersticios más pequeños, lo que puede atribuirse al deslizamiento de la pared. Para estimar la velocidad de deslizamiento, la velocidad de cizallamiento medida se representó gráficamente frente a la separación inversa de acuerdo con la ecuación 1. Se obtuvo un ajuste de modelo lineal (y = mx). Se aplicó a los datos un ajuste de modelo lineal (y = mx+ c) con el gradiente de la curva igual a 2Vs y el intercepto igual a la velocidad de cizallamiento real.
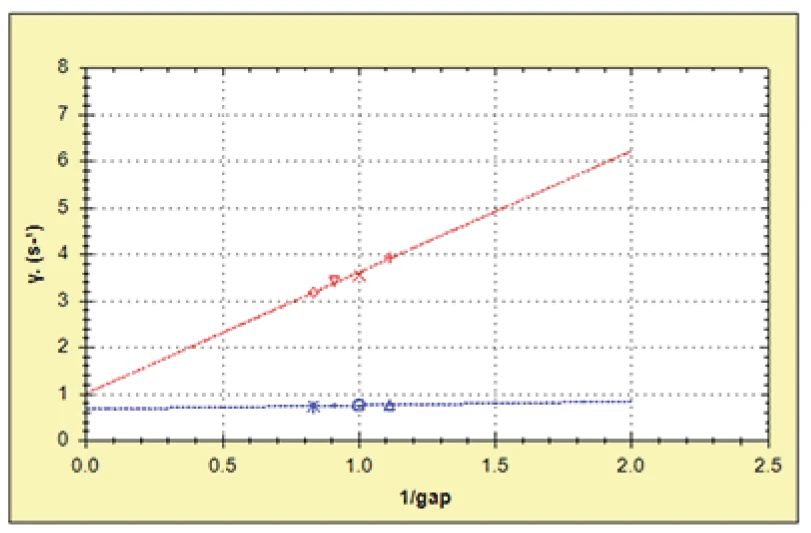
En el caso de la crema de piel, se estimó que la velocidad de deslizamiento era de 1,3 mm/s y la velocidad de cizallamiento real de 1,016 s-1. Este valor es bastante inferior a los valores de velocidad de cizallamiento (aparente) medidos, que oscilan entre 3 y 4 s-1, lo que sugiere un grado significativo de deslizamiento de la pared. En consecuencia, para futuros ensayos, se recomienda utilizar placas rugosas o dentadas para esta muestra en particular.
En el caso del gel de ducha, la velocidad de deslizamiento se estimó en sólo 0,08 mm/s, con una velocidad de cizallamiento real de 0,68 s-1, en comparación con el valor aparente de aproximadamente 0,76 s-1. Esta diferencia se encuentra dentro del rango de error probable. Esta diferencia está dentro del margen de error probable asociado a la prueba y, por tanto, puede considerarse que el gel de ducha no muestra deslizamiento en estas condiciones de medición.
Conclusión
Se ensayaron un gel de ducha y una crema para la piel con varias separaciones para evaluar la velocidad de deslizamiento en la interfaz pared-muestra. La crema para la piel mostró un deslizamiento significativo de la pared, mientras que en el caso del gel de ducha fue insignificante. Por tanto, este ensayo puede utilizarse para estimar el grado de deslizamiento para un material y unas condiciones de ensayo específicos e indicar si es necesario utilizar geometrías rugosas o perfiladas.
Tenga en cuenta...
que las pruebas deben realizarse con una combinación de geometría de placas paralelas lisas.