Introduction
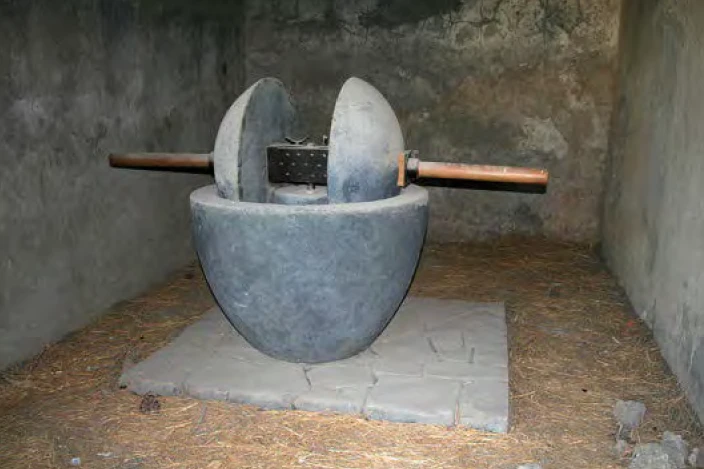
La plupart des huiles de cuisine sont extraites de plantes ou de graines de plantes. La première culture ciblée d'oliviers aurait eu lieu sur l'île de Crète vers l'an 3500 avant J.-C. Outre la consommation humaine et la production de savon, l'huile d'olive était également utilisée dans la liturgie catholique. La figure 1 montre un moulin à huile (broyeur d'olives) à Pompéi datant de 80 ans avant Jésus-Christ.
Les fruits et les graines dont on veut extraire l'huile sont d'abord nettoyés, puis écrasés entre des rouleaux. Étant donné que les huiles fraîchement pressées contiennent généralement des matières associées telles que des substances odorantes, aromatiques ou amères, ou des parties de plantes, des agents de trouble ou des mucilages, elles sont souvent raffinées afin de les préserver. Pour ce faire, l'huile brute est chauffée, ce qui entraîne non seulement la perte d'une partie de l'huile brute, mais aussi la réduction de substances bénéfiques sur le plan nutritionnel et physiologique, telles que les tocophérols. La teneur en acides gras polyinsaturés n'est toutefois pas affectée par cette étape de traitement. Les huiles raffinées se caractérisent par une odeur et un goût neutres, une durée de conservation plus longue et l'absence de sédimentation solide pendant le stockage.
Les huiles pressées à froid ne sont pas raffinées, mais extraites uniquement par pression et filtration. La chaleur générée lors du pressage est dissipée par le refroidissement de la presse. L'huile ainsi obtenue est appelée "pressée à froid", "étirée à froid", "non traitée" ou "non adultérée" ; elle est classée comme étant de très haute qualité [2, 3].
Les graisses et les huiles sont des triglycérides ou des esters triples de l'alcool trivalent glycérine (1, 2, 3- propanetriol). Les acides gras avec lesquels la glycérine est estérifiée sont classés en acides gras saturés, insaturés ou polyinsaturés. La raison pour laquelle les graisses sont solides à température ambiante alors que les huiles sont liquides est due à la teneur en acides gras insaturés. L'augmentation de la teneur en acides gras insaturés (principalement en position cis) entrave la CristallisationLa cristallisation est le processus physique de durcissement au cours de la formation et de la croissance des cristaux. Au cours de ce processus, la chaleur de cristallisation est libérée.cristallisation et abaisse le Températures et enthalpies de fusionL'enthalpie de fusion d'une substance, également connue sous le nom de chaleur latente, est une mesure de l'apport d'énergie, généralement de la chaleur, nécessaire pour convertir une substance de l'état solide à l'état liquide. Le point de fusion d'une substance est la température à laquelle elle passe de l'état solide (cristallin) à l'état liquide (fusion isotrope).point de fusion des huiles. On peut donc s'attendre à une corrélation entre les températures de Températures et enthalpies de fusionL'enthalpie de fusion d'une substance, également connue sous le nom de chaleur latente, est une mesure de l'apport d'énergie, généralement de la chaleur, nécessaire pour convertir une substance de l'état solide à l'état liquide. Le point de fusion d'une substance est la température à laquelle elle passe de l'état solide (cristallin) à l'état liquide (fusion isotrope). fusion et de CristallisationLa cristallisation est le processus physique de durcissement au cours de la formation et de la croissance des cristaux. Au cours de ce processus, la chaleur de cristallisation est libérée.cristallisation des huiles et leur teneur en acides gras insaturés.
Expérimental
Le comportement de Températures et enthalpies de fusionL'enthalpie de fusion d'une substance, également connue sous le nom de chaleur latente, est une mesure de l'apport d'énergie, généralement de la chaleur, nécessaire pour convertir une substance de l'état solide à l'état liquide. Le point de fusion d'une substance est la température à laquelle elle passe de l'état solide (cristallin) à l'état liquide (fusion isotrope). fusion et de CristallisationLa cristallisation est le processus physique de durcissement au cours de la formation et de la croissance des cristaux. Au cours de ce processus, la chaleur de cristallisation est libérée.cristallisation des huiles de cuisson disponibles dans le commerce a été étudié à l'aide de l'appareil NETZSCH DSC 204 F1 Phoenix® avec capteur μ. L'azote a été utilisé comme gaz de purge (5,0) ; le taux de gaz de purge s'élevait à 40 ml/min. Les huiles ont été introduites dans des creusets standard en aluminium avec des couvercles percés de manière à mouiller entièrement la zone inférieure des creusets. Les paramètres de mesure et les masses des échantillons sont résumés dans les tableaux 1 et 2.
Tableau 1 : Conditions de mesure
| Instrument de mesure | DSC 204 F1 Phoenix® |
| Capteur | capteur μ |
| Refroidissement | GN2, automatique |
| Creuset | Al, percé |
| Atmosphère | Azote |
| Débit de gaz | 40 ml/min |
| Taux de chauffage/refroidissement | 5 K/min |
Tableau 2 : Masse des échantillons [mg]
| Huile d'olive | Huile d'arachide | Huile de sésame | Huile de colza | Huile de tournesol | Huile de noix | |
|---|---|---|---|---|---|---|
| Producteur | A | B | C | C | D | B |
| Mesure 1 | 2.527 | 2.565 | 2.546 | 2.529 | 2.528 | 2.507 |
| Mesure 2 | 2.526 | 2.541 | 2.529 | 2.554 | 2.528 | 2.505 |
| Mesure 3 | 2.522 | 2.568 | 2.545 | 2.529 | 2.514 | 2.545 |
| Valeur moyenne (MW) | 2.525 | 2.558 | 2.540 | 2.537 | 2.530 | 2.519 |
| Écart (ABW) | 0.005 | 0.027 | 0.017 | 0.025 | 0.034 | 0.040 |
Résultats et discussion
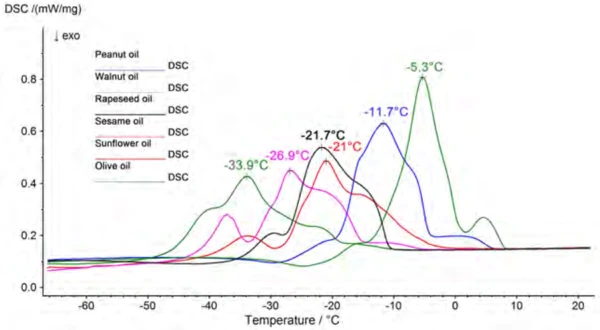
Les huiles de cuisson ont été étudiées dans les conditions de mesure susmentionnées, dans une plage de températures allant de -100°C à la température ambiante. La CristallisationLa cristallisation est le processus physique de durcissement au cours de la formation et de la croissance des cristaux. Au cours de ce processus, la chaleur de cristallisation est libérée.cristallisation des échantillons peut être observée dans les segments de refroidissement respectifs et la Températures et enthalpies de fusionL'enthalpie de fusion d'une substance, également connue sous le nom de chaleur latente, est une mesure de l'apport d'énergie, généralement de la chaleur, nécessaire pour convertir une substance de l'état solide à l'état liquide. Le point de fusion d'une substance est la température à laquelle elle passe de l'état solide (cristallin) à l'état liquide (fusion isotrope). fusion peut être observée dans les segments de chauffage. Étant donné que les huiles ont des teneurs différentes en acides gras saturés, monoinsaturés et polyinsaturés, et que les triglycérides sont constitués de mélanges de différents acides gras, tous les échantillons ont en commun une zone relativement large dans le domaine de la Températures et enthalpies de fusionL'enthalpie de fusion d'une substance, également connue sous le nom de chaleur latente, est une mesure de l'apport d'énergie, généralement de la chaleur, nécessaire pour convertir une substance de l'état solide à l'état liquide. Le point de fusion d'une substance est la température à laquelle elle passe de l'état solide (cristallin) à l'état liquide (fusion isotrope). fusion et de la CristallisationLa cristallisation est le processus physique de durcissement au cours de la formation et de la croissance des cristaux. Au cours de ce processus, la chaleur de cristallisation est libérée.cristallisation. La figure 2 montre une comparaison du comportement à la Températures et enthalpies de fusionL'enthalpie de fusion d'une substance, également connue sous le nom de chaleur latente, est une mesure de l'apport d'énergie, généralement de la chaleur, nécessaire pour convertir une substance de l'état solide à l'état liquide. Le point de fusion d'une substance est la température à laquelle elle passe de l'état solide (cristallin) à l'état liquide (fusion isotrope). fusion des différentes huiles.
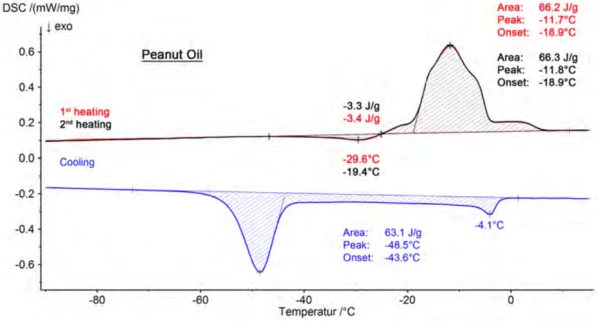
La figure 3 présente les résultats pour l'huile d'arachide, qui consistent en deux segments de chauffage et un segment de refroidissement entre les deux. En outre, le début du processus de fusion (début extrapolé) et la température maximale du composant principal sont évalués pour chaque échantillon. Une comparaison de ces résultats est résumée dans le tableau 3. Les valeurs indiquées sont des valeurs moyennes calculées à partir de six valeurs mesurées. Une tendance constante à la baisse des températures est observée, tant pour le début que pour le pic de fusion, dans l'ordre suivant : huile d'olive, huile d'arachide, huile de sésame, huile de colza, huile de tournesol, huile de noix.
En comparant les teneurs en acides gras saturés (colonne 1), monoinsaturés (colonne 2) et polyinsaturés (colonne 3) des huiles de cuisson analysées dans le tableau 4, dans l'ordre allant de l'huile d'olive à l'huile de noix, aucune tendance ne se dégage pour les colonnes 1 à 3. Même la teneur totale en acides gras insaturés de la colonne 4 (somme des colonnes 2 et 3) ne présente pas de tendance correspondant directement à l'ordre choisi pour les huiles de cuisson dans le tableau 4. La relation entre la teneur en acides gras et la Températures et enthalpies de fusionL'enthalpie de fusion d'une substance, également connue sous le nom de chaleur latente, est une mesure de l'apport d'énergie, généralement de la chaleur, nécessaire pour convertir une substance de l'état solide à l'état liquide. Le point de fusion d'une substance est la température à laquelle elle passe de l'état solide (cristallin) à l'état liquide (fusion isotrope). température de fusion est illustrée plus clairement dans la figure 4. On constate que la Températures et enthalpies de fusionL'enthalpie de fusion d'une substance, également connue sous le nom de chaleur latente, est une mesure de l'apport d'énergie, généralement de la chaleur, nécessaire pour convertir une substance de l'état solide à l'état liquide. Le point de fusion d'une substance est la température à laquelle elle passe de l'état solide (cristallin) à l'état liquide (fusion isotrope). température de fusion augmente avec la teneur en acides gras saturés et monoinsaturés et qu'elle diminue avec la teneur en acides gras polyinsaturés.
Tableau 3 : Températures de départ et de pointe extrapolées des processus de fusion [°C]
| Huile d'olive | Huile d'arachide | Huile de sésame | Huile de colza | Huile de tournesol | Huile de noix | |
|---|---|---|---|---|---|---|
| Producteur | A | B | C | C | D | B |
| Début extrapolé | -10.1 | -18.9 | -28.3 | -28.0 | -31.5 | -44.9 |
| Température maximale | -5.1 | -11.8 | -21.0 | -21.4 | -26.7 | -34.0 |
Tableau 4 : Compilation des huiles de cuisson et de leurs teneurs [4]
Teneur en acides gras [%] | |||||
|---|---|---|---|---|---|
| saturés (S) | monoinsaturés | polyinsaturés | insaturés totaux (P) | P:S | |
| Huile de noix1 | 9.87 | 16.3 | 73.9 | 90.2 | 7.49 |
| Huile de tournesol2 | 12.3 | 20.7 | 66.9 | 87.6 | 5.44 |
| Huile de colza1 | 6.9 | 57.1 | 26.9 | 84.0 | 3.90 |
| Huile de sésame1 | 13.1 | 35.8 | 42.0 | 77.8 | 3.21 |
| Huile d'arachide2 | 16.4 | 44.8 | 38.8 | 83.6 | 2.37 |
| Huile d'olive1 | 15.0 | 74.7 | 9.89 | 84.6 | 0.66 |
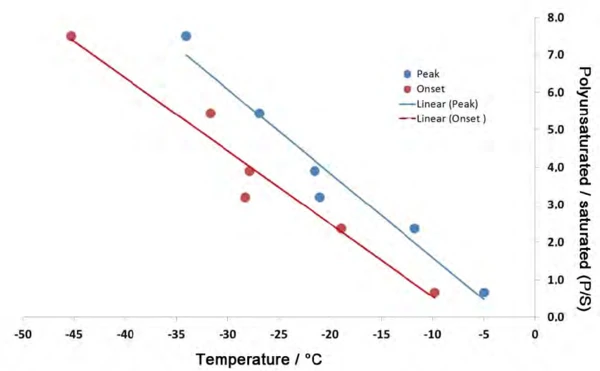
En outre, pour déterminer la qualité des huiles destinées à l'analyse alimentaire, ce ne sont pas tant les valeurs absolues des différentes teneurs en acides gras que leurs relations mutuelles qui sont déterminantes. En effet, si l'on crée un ensemble de rapports à partir des colonnes 4 et 1 - c'est-à-dire le rapport entre la teneur totale en acides gras insaturés et la teneur en acides gras saturés (P:S) - une tendance cohérente se dégage, puisque les valeurs diminuent de 7,49 pour l'huile de noix à 0,66 pour l'huile d'olive (comparer à la colonne 5). Les couleurs du tableau 4 illustrent deux groupes d'échantillons. Les valeurs marquées en vert décrivent les huiles dont la teneur en acides gras polyinsaturés est supérieure à celle des acides gras monoinsaturés. Les valeurs marquées en rouge, en revanche, désignent les huiles dont la teneur en acides gras monoinsaturés est supérieure à celle des acides gras polyinsaturés.
Il faut tenir compte du fait que les informations sur les teneurs en acides gras des échantillons d'huile de tournesol et d'huile d'arachide ne reflètent que des valeurs moyennes tirées de la littérature. L'expérience montre qu'il faut tenir compte d'une marge de fluctuation d'environ 5 % pour chaque valeur. En outre, lors de l'évaluation des résultats DSC, seules les températures maximales des principaux composants ont été prises en compte, ce qui ne constitue certainement qu'un point de référence pour l'analyse du comportement de fusion d'un mélange et peut expliquer les écarts existants dans le diagramme de corrélation (figure 5). La valeur de l'huile de sésame avec un P:S de 3,21 est celle qui s'éloigne le plus de la ligne de tendance de la figure 5. Cela peut s'expliquer par le fait qu'il s'agit de la seule huile de cette série dont les graines ont été soumises à un processus de torréfaction supplémentaire. L'influence du processus de torréfaction sur la CristallisationLa cristallisation est le processus physique de durcissement au cours de la formation et de la croissance des cristaux. Au cours de ce processus, la chaleur de cristallisation est libérée. cristallisation n'est pas encore connue.
Conclusion
Cette note d'application démontre que le comportement de fusion et de CristallisationLa cristallisation est le processus physique de durcissement au cours de la formation et de la croissance des cristaux. Au cours de ce processus, la chaleur de cristallisation est libérée. cristallisation de différentes huiles de cuisson peut être caractérisé au moyen de la calorimétrie différentielle à balayage (DSC). Une préparation facile des échantillons et un programme de température standard permettent d'obtenir rapidement des résultats de mesure sur les valeurs du comportement de fusion et de CristallisationLa cristallisation est le processus physique de durcissement au cours de la formation et de la croissance des cristaux. Au cours de ce processus, la chaleur de cristallisation est libérée. cristallisation. L'évaluation basée sur les températures maximales permet d'obtenir facilement une comparaison significative des huiles de cuisson.
Bien que cette étude ait fondamentalement confirmé qu'une teneur plus élevée en acides gras polyinsaturés se traduit par une Températures et enthalpies de fusionL'enthalpie de fusion d'une substance, également connue sous le nom de chaleur latente, est une mesure de l'apport d'énergie, généralement de la chaleur, nécessaire pour convertir une substance de l'état solide à l'état liquide. Le point de fusion d'une substance est la température à laquelle elle passe de l'état solide (cristallin) à l'état liquide (fusion isotrope). température de fusion plus basse pour une huile, la figure 4 montre également que la concentration n'est pas le seul facteur décisif. La figure 5 montre que c'est plutôt le rapport P:S - c'est-à-dire la concentration d'acides gras polyinsaturés par rapport aux acides gras saturés - qui présente une tendance constante.