
03.08.2020 by Milena Riedl
TGA-FT-IR – Your Solution to Identify a Polymer Blend and its Composition
Polymer blends offer significant advantages during their service life. However, they make recycling at the end of life difficult. One of the most fundamental problems is the identification of the material as a blend as well as its composition to ensure it is sorted properly and can be reused if possible. Read how to TGA and FT-IR help with the identification and join our webinar series on TG-FT-IR!
Polymer blends are the combination of two or more polymers . They are combined to create a new material with enhanced physical properties compared to the individual raw materials.
While blends offer significant advantages during their service life, they make recycling at the end of life difficult. One of the most fundamental problems is the identification of the material as a blend as well as its composition to ensure it is sorted properly and can be reused if possible.
Identification with TGA and the FT-IR spectrometer by Bruker Optics
The identification of the components of a blend can be done by the combination of TGA and FT-IR. On the one hand, the mass-loss steps give information about the polymer amount. The PyrolysisPyrolysis is the thermal decomposition of organic compounds in an inert atmosphere.pyrolysis gases, detected by FT-IR, act as the fingerprint of the polymer and help with the identification on the other.
Different blends were investigated with the NETZSCH PERSEUS® TG 209 F1 Libra®.
Example 1: Quantitative analysis of different polymer components
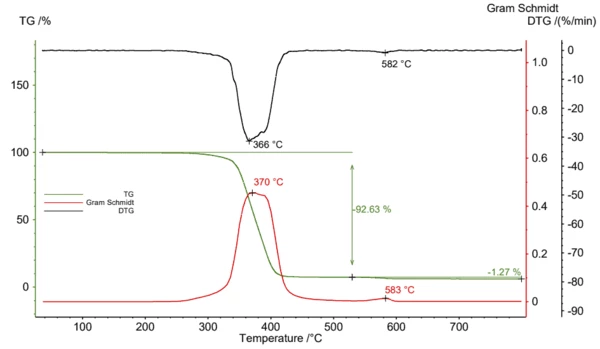
Figure 1 depicts the obtained TGA-FT-IR data of the POM/PTFE blend. Two mass-loss steps of 92.6% and 1.3% were detected with peaks in the DTG curve at 366°C and 582°C. The Gram Schmidt signal, displaying the overall IR-changes, behaves like the mirror image of the DTG. Maxima were observed in the same temperature region.
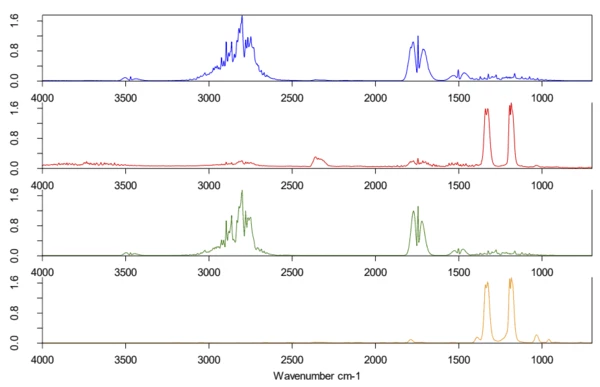
For identification of the evolved gases, the single spectra are extracted and compared to the NETZSCH FT-IR Database of Polymers, which consists of PyrolysisPyrolysis is the thermal decomposition of organic compounds in an inert atmosphere.pyrolysis spectra of common polymers. The 2D spectrum during the first mass-loss step was in good accordance with the PyrolysisPyrolysis is the thermal decomposition of organic compounds in an inert atmosphere.pyrolysis gases of POM (green). PTFE Decomposition reactionA decomposition reaction is a thermally induced reaction of a chemical compound forming solid and/or gaseous products. decomposition products (orange) were found during the second mass-loss step, compare figure 2. From the analysis, it can be conducted that the investigated blend was mainly made of POM (92.6%) with some minor amount of PTFE (1.3%).
Example 2: Detection between components with FT-IR
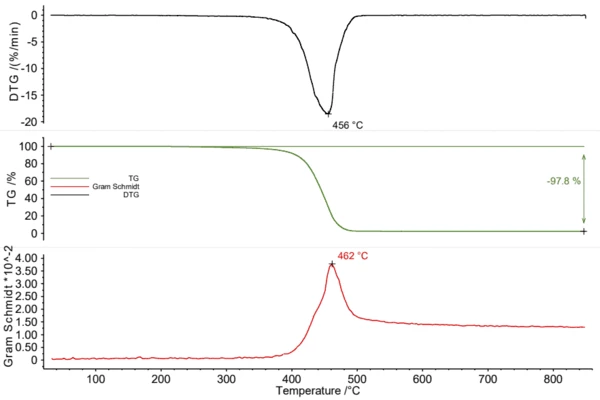
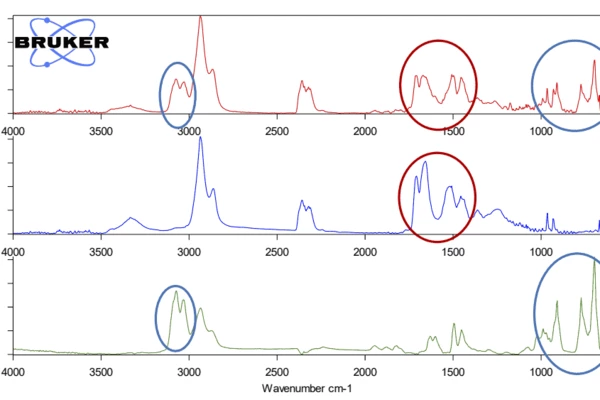
The second exemplary blend which was investigated was a mixture of PA6 and ABS. Figure 3 displays the TGA curve with a mass loss of 98 % of the Gram Schmidt curve with a peak at 462°C. From these curves, it could not be seen that the investigated sample consists of more than one material. Only evolved gas analysis can give more insight. The 2D spectrum was extracted at 456°C (red) and compared to the NETZSCH FT-IR Database of Polymers, see figure 5. This comparison clearly reveals that the measured spectrum is a mixture of more than one polymer. PA6 was found with the highest similarity. After the spectrum subtraction, ABS was found as the second compound of this mixture. The red circles show unique VibrationA mechanic process of oscillation is called vibration. Vibration is a mechanical phenomenon whereby oscillations occur about an equilibrium point. In many cases, vibration is undesirable, wasting energy and creating unwanted sound. For example, the vibrational motions of engines, electric motors, or any mechanical device in operation are typically unwanted. Such vibrations could be caused by imbalances in the rotating parts, uneven friction, or the meshing of gear teeth. Careful designs usually minimize unwanted vibrations.vibration bands for PA6 in the measured spectrum, whereas the blue circles mark characteristic bands for ABS.
Powerful solution to identify components of polymer blends
The hyphenation of TGA and FT-IR is a very suitable tool to identify polymer blends. TGA curves enable quantification of the polymer content, whereas identification of the polymers is done over the PyrolysisPyrolysis is the thermal decomposition of organic compounds in an inert atmosphere.pyrolysis gases compared to the gas phase library NETZSCH FT-IR Database of Polymers. It is a good solution when quantifiable results are needed or the polymer is black, which can make FT-IR analysis via ATR difficult.
Learn more about TGA-FT-IR and the NETZSCH FT-IR Database of Polymers in our upcoming webinar series with Bruker Optics!
There are a lot of powerful analysis methods available that aid in material development, process optimization and assessment of the service life of your products. But few can be combined to provide you even more valuable information. One of the best-known examples in material science is the combination of Thermogravimetry (TGA) and Fourier-Transform Infrared (FT-IR) spectroscopy.
Bruker Optics and NETZSCH are hosting a webinar series in August to show you more powerful examples why TGA-FT-IR is your solution to analyze the material composition of products or the failure of components during their service life.
On August 6, 2020, Dr. Ekkehard Füglein from NETZSCH will focus on the analysis of material composition using TGA and TG-FT-IR.
On August 13, 2020, Dr. Sergey Shilov from Bruker Optics will focus on failure analysis with TG-FT-IR.