Introduction
Porous concrete is one of the best known and most frequently used insulating materials in the building industry. One of the most important properties of insulating materials is their Thermal ConductivityThermal conductivity (λ with the unit W/(m•K)) describes the transport of energy – in the form of heat – through a body of mass as the result of a temperature gradient (see fig. 1). According to the second law of thermodynamics, heat always flows in the direction of the lower temperature.thermal conductivity. For thermal characterization, there are two main instruments. The steady-state methods Heat Flow Meter (HFM) and Guarded Hot Plate (GHP) are standardized test methods for determining the Thermal ConductivityThermal conductivity (λ with the unit W/(m•K)) describes the transport of energy – in the form of heat – through a body of mass as the result of a temperature gradient (see fig. 1). According to the second law of thermodynamics, heat always flows in the direction of the lower temperature.thermal conductivity of insulating materials.


Measurement Parameters
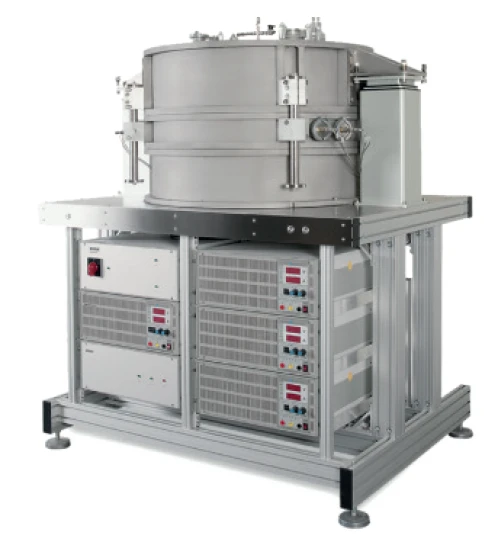
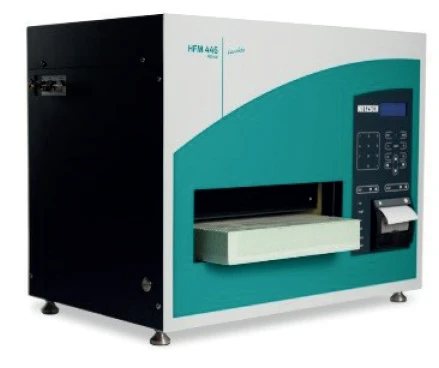
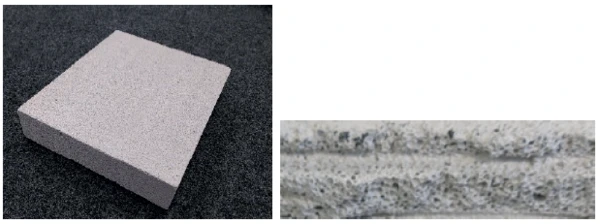
The effective Thermal ConductivityThermal conductivity (λ with the unit W/(m•K)) describes the transport of energy – in the form of heat – through a body of mass as the result of a temperature gradient (see fig. 1). According to the second law of thermodynamics, heat always flows in the direction of the lower temperature.thermal conductivity of porous materials depends heavily on the DensityThe mass density is defined as the ratio between mass and volume. density. Two specimens of porous concrete (300 mm x 250 mm x 60 mm, see figure 3) with slightly different densities were examined with regard to their Thermal ConductivityThermal conductivity (λ with the unit W/(m•K)) describes the transport of energy – in the form of heat – through a body of mass as the result of a temperature gradient (see fig. 1). According to the second law of thermodynamics, heat always flows in the direction of the lower temperature.thermal conductivity using the HFM 446 Lambda Medium (figure 2) and the GHP 456 HT Titan® (figure 1) from 10°C to 75°C.
The HFM 446 Lambda Medium applies a relative method with an asymmetric setup using a calibration of heatflux sensors with a known reference material. The specimens are investigated individually. The GHP 456 HT Titan® applies an absolute method with a symmetric setup which uses two similar specimens for the measurement.

Measurement Results
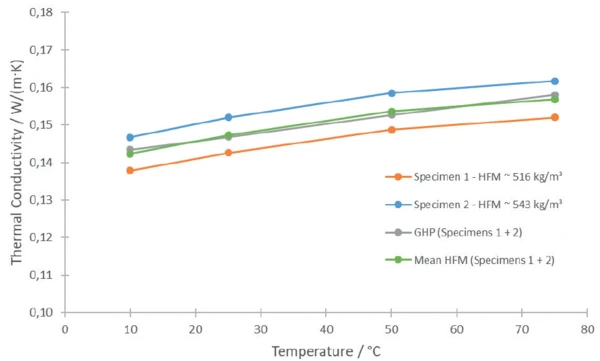
In the present case, the DensityThe mass density is defined as the ratio between mass and volume. density of the two porous concrete specimens was slightly different. Specimen 1 had a DensityThe mass density is defined as the ratio between mass and volume. density of approx. 516 kg/m³ and Specimen 2 of approx. 543 kg/m³ (difference ~5%). Figure 4 depicts the Thermal ConductivityThermal conductivity (λ with the unit W/(m•K)) describes the transport of energy – in the form of heat – through a body of mass as the result of a temperature gradient (see fig. 1). According to the second law of thermodynamics, heat always flows in the direction of the lower temperature.thermal conductivity of both concrete specimens. The orange points represent the measurement values for Specimen 1 measured with the HFM; the blue points represent Specimen 2. Specimen 1 shows a 6-7% lower thermal conductivity than Specimen 2. The mean values calculated using the individual measurements from the HFM coincide almost perfectly with the values from the GHP measurement where both specimens were used. The deviation is less than 0.8%.

The steady-state method for determining thermal conductivity requires a constant and one-dimensional heat flow through the specimens at all time. This is realized by continuously applying a heat source and sink to the specimen.
Measurement technique: Heat Flow Meter (HFM) and Guarded Hot Plate Apparatus (GHP)
In contrast, in transient methods, the heat energy transferred through the specimen is not constant. The heat flow rate varies. This can be caused, for example, by a short energy impulse on the specimen. Measurement techniques: Laser (Light) Flash Analysis (LFA)
Conclusion
The thermal conductivity of two different porous concrete specimens was investigated with two different steady state methods. The HFM measurements on the individual specimens show the differences caused by the different densities of the specimens. Also, the GHP device can handle samples with slightly different properties yielding an appropriate mean value. Both instruments are well suited for the characterization of insulating materials.