Introduction
Whether the long-term stability of an emulsion or suspension is governed by a zero shear viscosity or a Yield StressYield stress is defined as the stress below which no flow occurs; literally behaves like a weak solid at rest and a liquid when yielded.yield stress is dependent upon its microstructure. Furthermore, it is the state of this microstructure at long timescales that is important since this is ultimately what any dispersed phase will encounter over prolonged storage.
There are a number of tests for evaluating changes in rheological properties as a function of time. A CreepCreep describes a time and temperature dependent plastic deformation under a constant force. When a constant force is applied to a rubber compound, the initial deformation obtained due to the application of the force is not fixed. The deformation will increase with time.creep test is ideally suited to the task since it looks at the response to an applied StressStress is defined as a level of force applied on a sample with a well-defined cross section. (Stress = force/area). Samples having a circular or rectangular cross section can be compressed or stretched. Elastic materials like rubber can be stretched up to 5 to 10 times their original length.stress directly as a function of time. Another useful test is an oscillation frequency sweep where the sample is oscillated at a number of different frequencies consecutively. Since frequency is the inverse of time then high frequencies correspond to short timescales and low frequencies to long timescales. It should be noted that timescale corresponds to angular frequency (ω) as opposed to cycling frequency in oscillation testing.
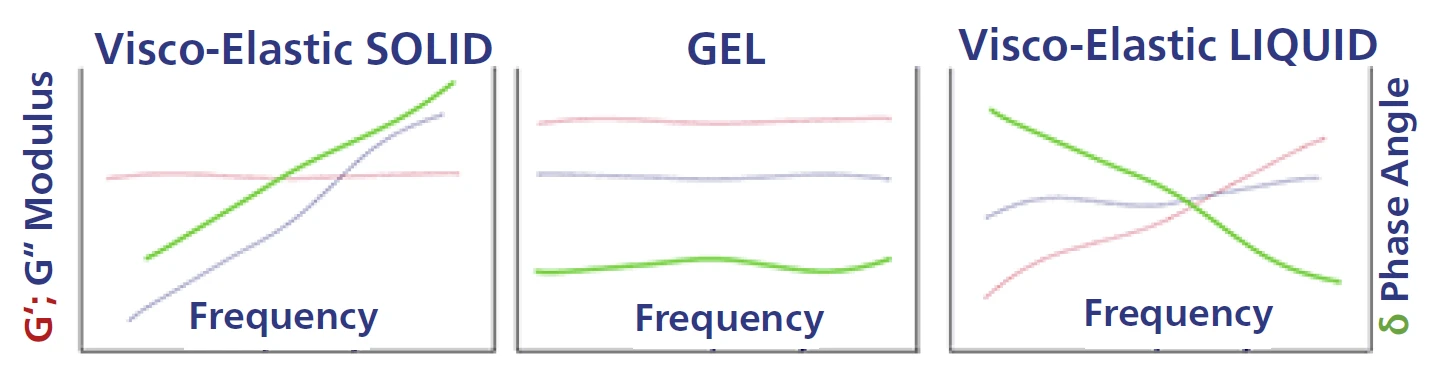
By evaluating changes in Elastic (or Storage) Modulus, G’; Viscous (or Loss) Modulus, G”; and phase angle, δ, over a limited frequency range, it is possible to determine whether a material is likely to have a Yield StressYield stress is defined as the stress below which no flow occurs; literally behaves like a weak solid at rest and a liquid when yielded.yield stress or a zero shear viscosity and also potential stability issues. Examples of common frequency responses for various materials are shown in Figure 1. If G’ exceeds G” at low frequencies e.g. <0.01Hz, then it can be inferred that the material possesses a network structure which needs to be broken down before flow can commence, i.e., it has a Yield StressYield stress is defined as the stress below which no flow occurs; literally behaves like a weak solid at rest and a liquid when yielded.yield stress. If G” exceeds G’ at low frequencies, this indicates that macroscopic flow can occur, and the stability is then likely to be governed by the zero shear viscosity or viscosity corresponding with the StressStress is defined as a level of force applied on a sample with a well-defined cross section. (Stress = force/area). Samples having a circular or rectangular cross section can be compressed or stretched. Elastic materials like rubber can be stretched up to 5 to 10 times their original length.stress imposed by the dispersed phase.
Since it is difficult to access these very low frequencies on a rheometer due to the long test times involved, it is useful to evaluate the general form of the curves. Since the phase angle, δ, and Elastic modulusThe complex modulus (elastic component), storage modulus, or G’, is the “real” part of the samples the overall complex modulus. This elastic component indicates the solid like, or in phase, response of the sample being measurement. Elastic Modulus, G’, are general indicators of structural characteristics, then the magnitude and direction of change with decreasing frequency can indicate the nature of the material response at longer times.
- If G‘ is largely independent of frequency and the phase angle remains either constant or decreases with reducing frequency, as with a viscoelastic solid or gel structure, then we can infer the material is more likely to maintain network structure and it will be more stable.
- If the phase angle, δ, increases and G‘ decreases with decreasing frequency then this indicates that the elastic elements of the structure (the network) are relaxing and is becoming liquid-like, this is likely to infer lower stability.
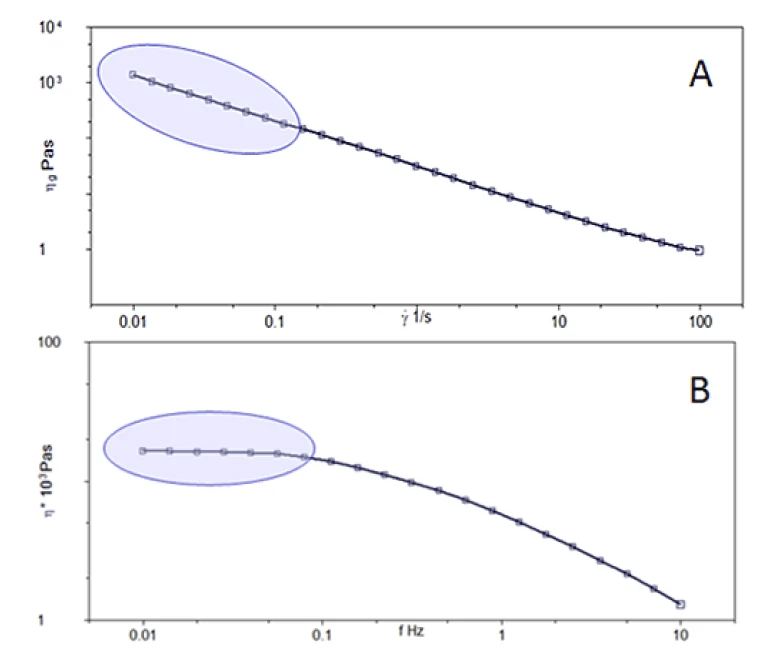
These observations should also be reflected in the complex viscosity, η*, which for fluids will show the onset of a zero shear viscosity plateau towards lower frequencies, while for solids possessing a network structure an ever increasing value of η* should be observed, as shown in Figure 2.
For practical use of this technique, it is important to evaluate the form of the curves under appropriate conditions. A minimum frequency of 0.01 Hz may be sufficient to evaluate stability potential, but going to a magnitude of frequency lower than this, although more time consuming will provide a more accurate picture of low frequency trends. The test temperature is important also since structural RelaxationWhen a constant strain is applied to a rubber compound, the force necessary to maintain that strain is not constant but decreases with time; this behavior is known as stress relaxation. The process responsible for stress relaxation can be physical or chemical, and under normal conditions, both will occur at the same time. relaxation will generally occur on shorter timescales with increasing temperatures due to a faster rate of structural rearrangement. Therefore testing at higher temperatures can better replicate real storage conditions and potentially make it easier to pick out problem samples. It is, however, important when working at higher temperatures over long timescales that sample evaporation is prevented.
This application note shows methodology and data from oscillation frequency testing for a series of shower gels, and their ability to suspend dispersed bubbles in the formulations.
Experimental
- A series of shower gels containing various levels of an associative thickening polymer (ranging from 0% up to 8%) were evaluated for their ability to suspend bubbles at room temperature for prolonged periods.
- Rotational rheometer measurements were made using a Kinexus rheometer with a Peltier plate cartridge and a cone and plate measuring system1, and utilizing standard pre-configured sequences in rSpace software.
- A standard loading sequence was used to ensure that the samples were subject to a consistent and controllable loading protocol. ∙ All rheology measurements were performed at 25°C unless specifically stated.
- A StrainStrain describes a deformation of a material, which is loaded mechanically by an external force or stress. Rubber compounds show creep properties, if a static load is applied.strain-controlled amplitude sweep is performed to measure the length of the Linear ViscoElastic Region (Linear Viscoelastic Region (LVER)In the LVER, applied stresses are insufficient to cause structural breakdown (yielding) of the structure and hence important micro-structural properties are being measured.LVER), and to determine an appropriate StrainStrain describes a deformation of a material, which is loaded mechanically by an external force or stress. Rubber compounds show creep properties, if a static load is applied.strain value to be used in the subsequent frequency sweep test (the Linear Viscoelastic Region (LVER)In the LVER, applied stresses are insufficient to cause structural breakdown (yielding) of the structure and hence important micro-structural properties are being measured.LVER determination is automated within rSpace software, and the StrainStrain describes a deformation of a material, which is loaded mechanically by an external force or stress. Rubber compounds show creep properties, if a static load is applied.strain value determined is fed forward into the next part of the sequence).
- A frequency sweep is performed at the pre-determined StrainStrain describes a deformation of a material, which is loaded mechanically by an external force or stress. Rubber compounds show creep properties, if a static load is applied.strain value within the Linear Viscoelastic Region (LVER)In the LVER, applied stresses are insufficient to cause structural breakdown (yielding) of the structure and hence important micro-structural properties are being measured.LVER, between default values of 10 Hz and 0.005 Hz.
Results and Discussion
Figure 3 shows the frequency sweep data for the range of shower gel products tested. It is clear that increasing the concentration of associative thickener increases the degree of elasticity as highlighted by the increase in G’ and decrease in phase angle. This elasticity arises through cross-linking of the surfactant micelles, which can form a gel-like structure at the right concentrations.
Samples with 6% and 8% associative polymer have higher values of G’ at the low frequencies indicating a greater extent of cross-linking, while the value and direction of the phase angle indicates that these materials are showing solid or gel-like behavior in this frequency range. This is favorable for stability since it indicates the likelihood of a Yield StressYield stress is defined as the stress below which no flow occurs; literally behaves like a weak solid at rest and a liquid when yielded.yield stress or at least a high zero shear viscosity at lower frequencies.
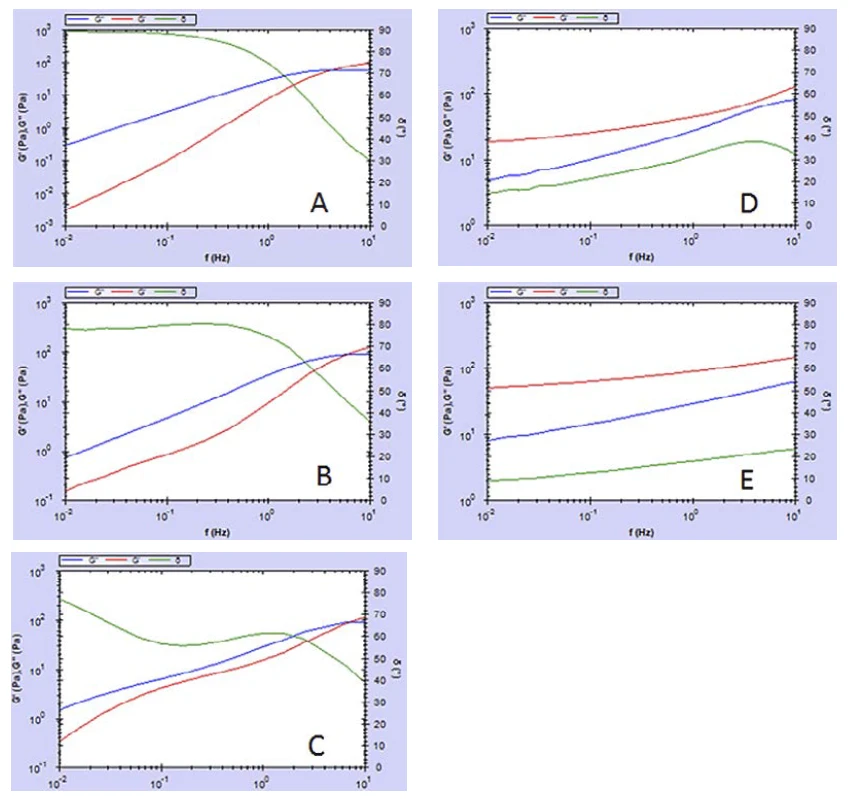
For the samples with lower values of associative polymer, G” is dominant and the phase angle is increasing with decreasing frequency, thus indicating structural RelaxationWhen a constant strain is applied to a rubber compound, the force necessary to maintain that strain is not constant but decreases with time; this behavior is known as stress relaxation. The process responsible for stress relaxation can be physical or chemical, and under normal conditions, both will occur at the same time. relaxation and hence liquid-like behavior in this frequency range, which is less than favorable for stability.
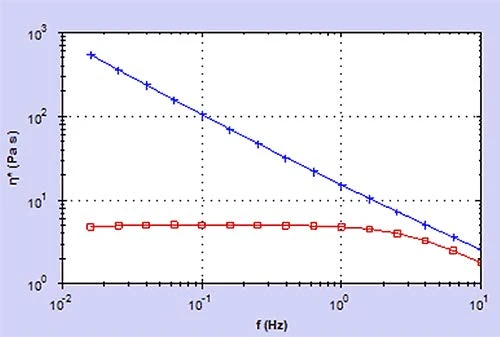
This is also reflected in complex viscosity, η* (see Figure 4), with the body wash containing no polymeric additive showing a zero shear viscosity plateau (i.e., liquid-like behavior) with a value of approx. 5 Pas. Conversely, the sample with 8% associative polymer displays power law behaviour over the same range with a viscosity close to 1000 Pas at 0.01 Hz. Whether or not the latter would show a plateau at lower frequencies can only be evaluated by testing to lower frequencies (or alternatively CreepCreep describes a time and temperature dependent plastic deformation under a constant force. When a constant force is applied to a rubber compound, the initial deformation obtained due to the application of the force is not fixed. The deformation will increase with time.creep testing) but nevertheless the viscosity at these lower frequencies should be sufficiently high to slow down sedimentation of a dispersed phase.
Conclusion
It is possible to predict dispersion stability by performing a frequency sweep test within the Linear Viscoelastic Region (LVER)In the LVER, applied stresses are insufficient to cause structural breakdown (yielding) of the structure and hence important micro-structural properties are being measured.LVER under the appropriate measurement conditions. This has been demonstrated for five shower gel products containing various concentrations of an associative thickening agent. Samples with high levels of polymer show gel-like behavior with higher values of G’ and a low phase angle which does not increase towards lower frequencies. These samples have been shown to be able to suspend bubbles for prolonged periods of time.
Please note ...
that a parallel plate geometry or a cylindrical geometry can also be used. A sand blasted geometry should be considered if the material is likely to show wall slip effects. Larger geometries are useful for measurements at low torques, which are more likely to be encountered at lower frequencies. The use of a solvent trap is also recommended for these tests since evaporation of solvent (e.g. , water) around the edges of the measuring system can invalidate the test, particularly when working at higher temperatures.