Introduction
The rheological properties of a product can influence how it is visually and texturally perceived by a consumer and how it is likely to behave during product use. For example, very Shear ThinningThe most common type of non-Newtonian behavior is shear thinning or pseudoplastic flow, where the fluid viscosity decreases with increasing shear.shear thinning materials will be highly responsive to changes in applied StressStress is defined as a level of force applied on a sample with a well-defined cross section. (Stress = force/area). Samples having a circular or rectangular cross section can be compressed or stretched. Elastic materials like rubber can be stretched up to 5 to 10 times their original length.stress while Newtonian materials will show much lesser dependence. Such a response is important when considering the ease of spreading or ‘spread-ability’.
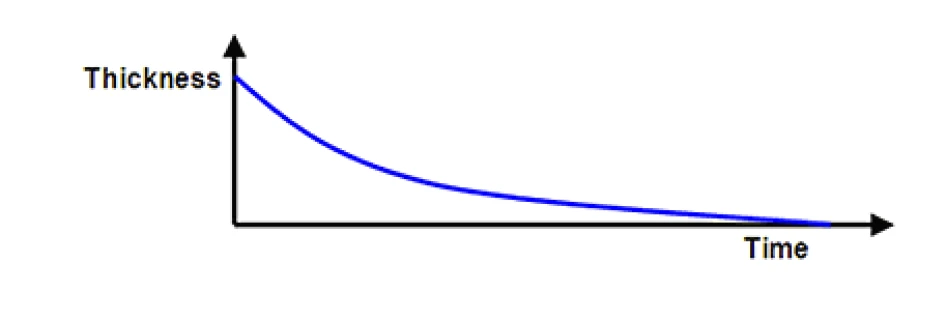
The process of spreading causes a consequent reduction in the layer thickness as it is distributed over a wider surface area as shown in Figure 1. Since shear rate is equal to the applied velocity divided by the layer thickness, spreading can therefore not be attributed to a single shear rate.
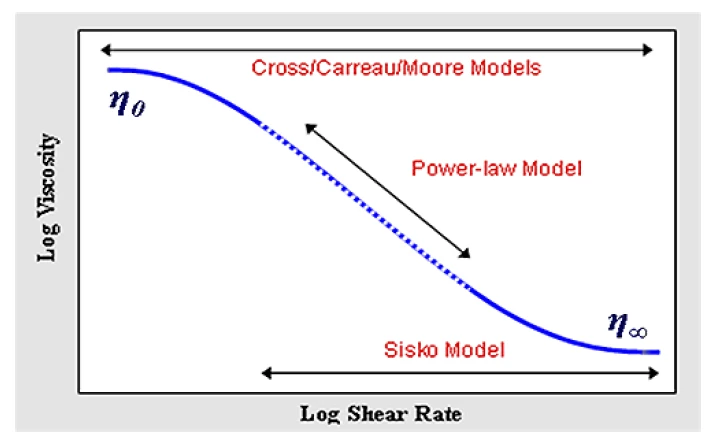
A better way of assessing spread-ability is by characterizing the change in viscosity over a range of shear rates as shown in Figure 2. The region of interest is the Shear ThinningThe most common type of non-Newtonian behavior is shear thinning or pseudoplastic flow, where the fluid viscosity decreases with increasing shear.shear thinning or power law region since this describes how easily the material structure breaks down with applied shear. This region appears linear on a log-log plot of viscosity vs. shear rate with a constant gradient, but shows power law dependence when plotted on a linear scale.
Mathematically this region of the flow curve can be described using the Power Law or Ostwald de Waele Model given by Equation 1.
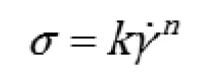
k is the consistency
n is the power law index
σ is the shear rate
Consistency has the units of Pasn but is numerically equal to the viscosity measured at 1 s-1. The power law index ranges from 0 for very Shear ThinningThe most common type of non-Newtonian behavior is shear thinning or pseudoplastic flow, where the fluid viscosity decreases with increasing shear.shear thinning materials to 1 for Newtonian materials.
The lower the StressStress is defined as a level of force applied on a sample with a well-defined cross section. (Stress = force/area). Samples having a circular or rectangular cross section can be compressed or stretched. Elastic materials like rubber can be stretched up to 5 to 10 times their original length.stress input required the easier the material should be to spread. A lower value of k means lower viscosity and hence lower StressStress is defined as a level of force applied on a sample with a well-defined cross section. (Stress = force/area). Samples having a circular or rectangular cross section can be compressed or stretched. Elastic materials like rubber can be stretched up to 5 to 10 times their original length.stress input, while a lower value of n indicates greater Shear ThinningThe most common type of non-Newtonian behavior is shear thinning or pseudoplastic flow, where the fluid viscosity decreases with increasing shear.shear thinning which translates to a smaller StressStress is defined as a level of force applied on a sample with a well-defined cross section. (Stress = force/area). Samples having a circular or rectangular cross section can be compressed or stretched. Elastic materials like rubber can be stretched up to 5 to 10 times their original length.stress increase with increasing shear rate.
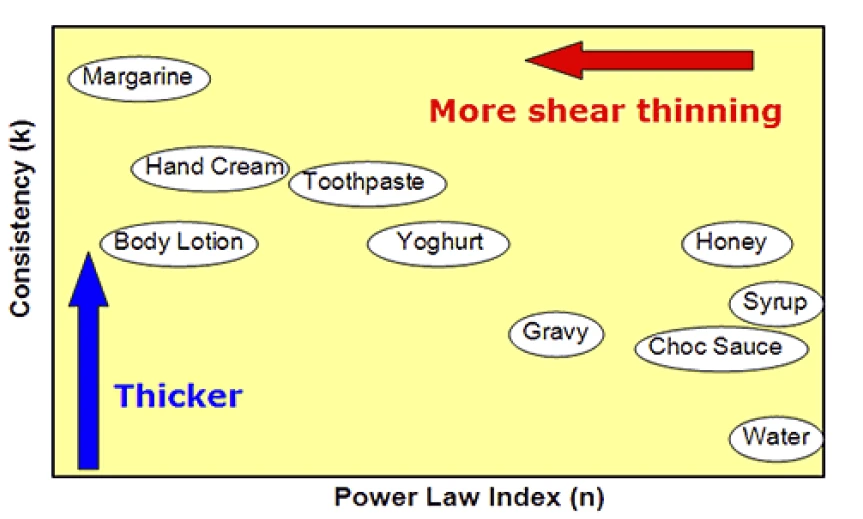
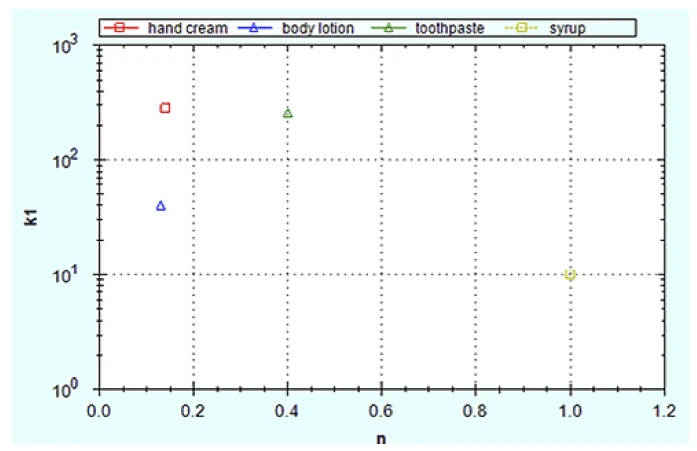
This information can be represented on a chart similar to that shown in Figure 3. Materials with low k values and/or low n values should be easiest to spread.
Experimental
- The spread-ability of a number of consumer products was evaluated by performing a shear rate ramp test and analyzing the resultant curve using a Power Law ModelThe power law model is a common rheological model to quantify (typically) the shear thinning nature of a sample, with the value closer to zero indicating a more shear thinning material.power law model.
- Rotational rheometer measurements were made using a Kinexus rotational rheometer with a Peltier plate cartridge and a roughened parallel plate measuring system1, and using standard pre-configured sequences in the rSpace software.
- A standard loading sequence was used to ensure that both samples were subject to a consistent and controllable loading protocol.
- All rheology measurements were performed at 25°C.
- The flow curve was generated using a shear rate ramp test and a Power Law ModelThe power law model is a common rheological model to quantify (typically) the shear thinning nature of a sample, with the value closer to zero indicating a more shear thinning material.power law model fitted to this curve.
Results and Discussion
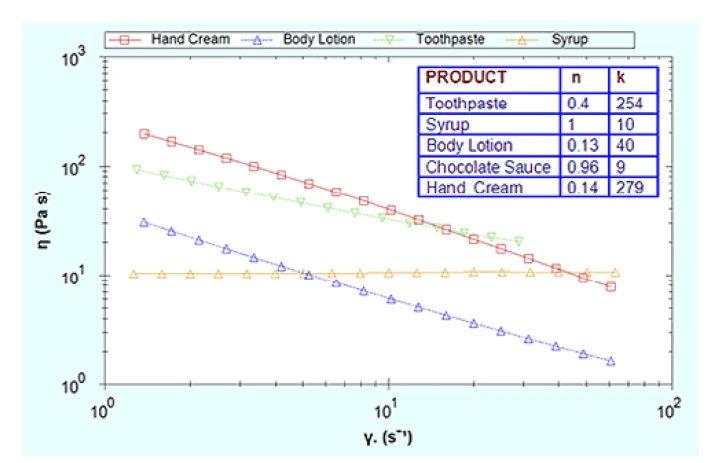
Figure 4 shows the viscosity-shear rate curve for a number of commercial products and their corresponding fitting parameters, with graphical presentation of the latter in Figure 5.
Although toothpaste and hand cream have similar k values, hand cream has a much lower n value making it more Shear ThinningThe most common type of non-Newtonian behavior is shear thinning or pseudoplastic flow, where the fluid viscosity decreases with increasing shear.shear thinning and easier to spread. Conversely, syrup and chocolate sauce have much lower k values but are not Shear ThinningThe most common type of non-Newtonian behavior is shear thinning or pseudoplastic flow, where the fluid viscosity decreases with increasing shear.shear thinning hence they appear thick and sticky during application. The body lotion has both a relatively low k and n value making it much easier to apply. To quantitatively compare the StressStress is defined as a level of force applied on a sample with a well-defined cross section. (Stress = force/area). Samples having a circular or rectangular cross section can be compressed or stretched. Elastic materials like rubber can be stretched up to 5 to 10 times their original length.stress requirement for the spreading of a hand cream and syrup respectively at equivalent shear rates the values of n and k can be substituted into Equation 1. Considering a single shear rate of 1 s-1 which may equivocate with a thicker product layer than the StressStress is defined as a level of force applied on a sample with a well-defined cross section. (Stress = force/area). Samples having a circular or rectangular cross section can be compressed or stretched. Elastic materials like rubber can be stretched up to 5 to 10 times their original length.stress required to maintain flow at this shear rate is 279 Pa for the hand cream and 10 P a for syrup (σ = k at 1 s-1). At a shear rate of 1000 s-1 which would relate to a thinner layer of material resulting from the spreading process the StressStress is defined as a level of force applied on a sample with a well-defined cross section. (Stress = force/area). Samples having a circular or rectangular cross section can be compressed or stretched. Elastic materials like rubber can be stretched up to 5 to 10 times their original length.stress requirement increases to 734 Pa for the hand cream and 10,000 Pa for the syrup. This highlights importance of Non-NewtonianA non-Newtonian fluid is one that exhibits a viscosity that varies as a function of the applied shear rate or shear stress.non-Newtonian behavior in the spreading process.
Conclusion
A shear rate ramp test with a Power Law ModelThe power law model is a common rheological model to quantify (typically) the shear thinning nature of a sample, with the value closer to zero indicating a more shear thinning material.power law model fit was used to characterize the spread-ability of various commercial products using the power law fitting parameters k and n. Low values of k and n indicate lower viscosity and a greater degree of Shear ThinningThe most common type of non-Newtonian behavior is shear thinning or pseudoplastic flow, where the fluid viscosity decreases with increasing shear.shear thinning respectably, which will contribute to easier spreading.
Please note...
that testing is recommended to be undertaken with cone and plate or parallel plate geometry – with the latter being preferred for dispersions and emulsions with large particle sizes. Such material types may also require the use of serrated or roughened geometries to avoid artefacts relating to slippage at the geometry surface.