Introduction
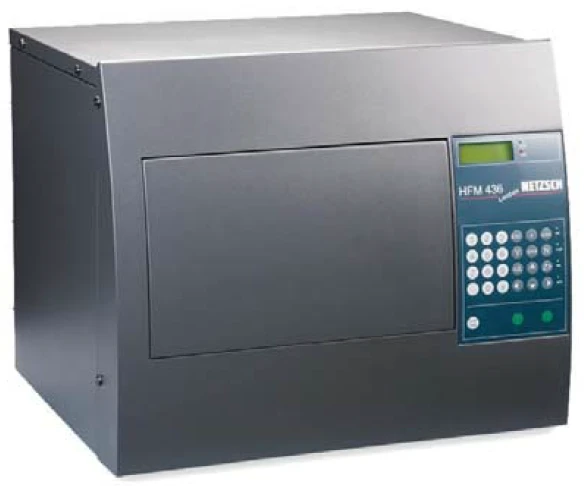
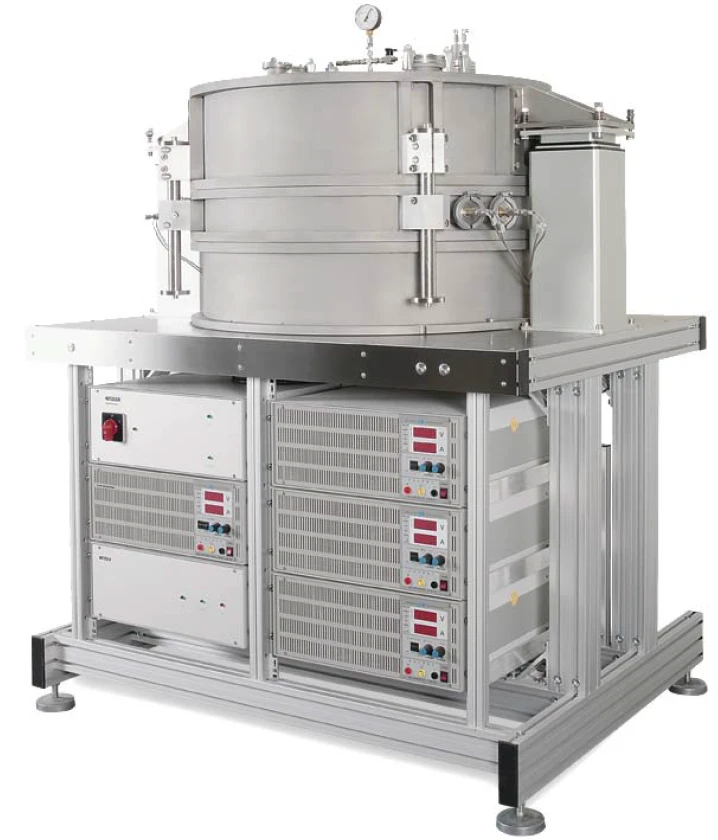
The thermal performance of rigid and higher Thermal ConductivityThermal conductivity (λ with the unit W/(m•K)) describes the transport of energy – in the form of heat – through a body of mass as the result of a temperature gradient (see fig. 1). According to the second law of thermodynamics, heat always flows in the direction of the lower temperature.thermal conductivity (lower thermal resistance) building materials such as lumber, gypsum board, concrete, stone and other masonry products can be measured using the HFM and GHP instruments (figure 1 and 2). These methods are standardized test techniques and the application (insulating and building materials) is strongly connected with e.g., the following standards:
- ISO 8301:1991: Thermal insulation – Determination of steady-state thermal resistance and related properties – Heat flow meter appratus.
- ISO 8302:1991: Thermal insulation – Determination of steady-state thermal resistance and related properties – Guarded hot plate apparatus.
- ASTM C518: Standard test method for steady-state heat flux measurements and thermal transmission properties by means of the heat flow meter apparatus.
- ASTM C177: Standard test method for steady-state heat flux measurements and thermal transmission properties by means of the guarded hot plate apparatus.
- DIN EN 12667/12939:2001: Thermal performance of building materials and products – Determination of thermal resistance by means of guarded hot plate and heat flow meter methods – (thick) products of high and medium thermal resistance.
- DIN EN 13163:2001: Thermal insulation products for buildings – Factory made products of expanded polystyrene (EPS) – Specification.
With the absolute GHP method an accuracy of ±2% can be achieved. The HFM method requires a calibration of the instrument. Depending on the reference material, accuracies of ±2% can also be obtained.
How to Handle Rigid Samples with Rough Surfaces
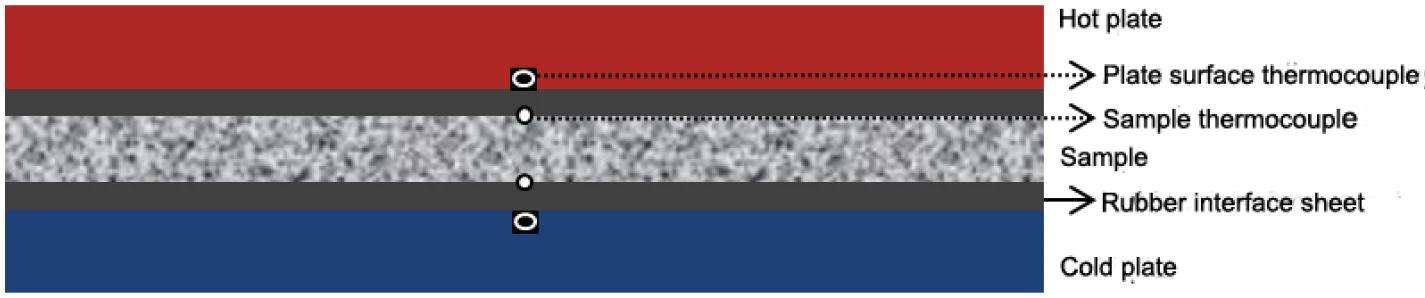
However, both methods may require careful sample preparation and special techniques for accurate surface temperature measurements. The above mentioned materials (e.g., concrete) can have rough surfaces and preparation of thermohighly fl at and parallel surfaces can be diffi cult. As a result, a significant interface thermal resistance (temperature drop) may be present in any air gaps between the instrument plates and sample surfaces. If this thermal resistance becomes signifi cant compared to the sample thermal resistance, temperature sensors mounted in the plate surface can no longer be used to measure the temperature diff erence across the sample. One technique is to mount additional small diameter thermocouples on the sample surfaces and place a compliant interface sheet such as silicone rubber between the plates and sample surfaces as shown in figure 3 below.
Measurement Parameters
For this study, three pairs of concrete samples (305 mm by 305 mm by approximately 50 mm thickness) were tested using the GHP method (double-sided), and then each of the six samples was tested using the HFM method. For each method, sample surface mounted thermocouples and silicone rubber interface sheets approximately 2 mm thickness were used. The HFM 436 was calibrated using the NIST 1450b (Standard Reference Material®) fiberglass board with a thickness of 25 mm. The temperature measurement was achieved by plugging the sample thermocouples into the data acquisition channels used for the plate thermocouples and then the automatic off set adjustment in the software could adjust the plate temperatures during the test to get the specified sample temperature diff erence. The equilibrium parameters were set to 1% (rough) and 0.1% (fine). The tests were carried out at room temperature (mean sample temperature, see table 1). The temperature difference between the two GHP plates was approximately 26 K with 12 K temperature diff erence across the sample. For the HFM, plate temperature difference was approximately 18 K with 8 K across the sample.
Test Results
The results are presented in Table 1. The Thermal ConductivityThermal conductivity (λ with the unit W/(m•K)) describes the transport of energy – in the form of heat – through a body of mass as the result of a temperature gradient (see fig. 1). According to the second law of thermodynamics, heat always flows in the direction of the lower temperature.thermal conductivity of 1.8 W/(m.K) for the higher DensityThe mass density is defined as the ratio between mass and volume. density concrete sample C is significantly higher compared to 1.2 - 1.3 W/(m.K) for A and B, as expected. The agreement between the methods is quite good, especially considering the low thermal resistance of the samples and imperfect surfaces. The average of the Thermal ConductivityThermal conductivity (λ with the unit W/(m•K)) describes the transport of energy – in the form of heat – through a body of mass as the result of a temperature gradient (see fig. 1). According to the second law of thermodynamics, heat always flows in the direction of the lower temperature.thermal conductivity measured by HFM for the individual samples ranges from 4.1% lower to 2.4% higher compared to the GHP measurement of both samples.
Table 1: Thermal conductivity measurements of concrete by GHP and HFM
Sample | Thickness (mm) | DensityThe mass density is defined as the ratio between mass and volume. Density (Kg/m3) | Mean temperature (°C) | Thermal conductivity (W/(m.K)) | Thermal resistance (m.K/W) |
|---|---|---|---|---|---|
| A1, A2 (GHP) | 52.6 | 1896 | 24.1 | 1.36 | 0.0387 |
| A1 (HFM) | 53.6 | 1897 | 23.9 | 1.38 | 0.0387 |
| A2 (HFM) | 51.6 | 1895 | 23.9 | 1.23 | 0.0421 |
| A1, A2 (avg., HFM) | 52.6 | 1896 | 23.9 | 1.31 | 0.0404 |
| Variation | -4.0% | ||||
| B1, B2 (GHP) | 51.1 | 1909 | 25.0 | 1.27 | 0.0402 |
| B1 (HFM) | 51.1 | 1935 | 23.9 | 1.23 | 0.0416 |
| B2 (HFM) | 51.0 | 1882 | 24.1 | 1.21 | 0.0423 |
| B1, B2 (avg., HFM) | 51.1 | 1909 | 24.0 | 1.22 | 0.0419 |
| Variation | -4.1% | ||||
| C1, C2 (GHP) | 51.4 | 2297 | 25.2 | 1.76 | 0.0292 |
| C1 (HFM) | 51.7 | 2298 | 23.4 | 1.92 | 0.0269 |
| C2 (HFM) | 51.1 | 2296 | 23.8 | 1.69 | 0.0303 |
| C1, C2 (avg., HFM) | 51.4 | 2297 | 23.6 | 1.80 | 0.0286 |
| Variation | 2.4% | ||||
Conclusion
Both, the absolute GHP and the relative HFM method, are qualifi ed to determine the Thermal ConductivityThermal conductivity (λ with the unit W/(m•K)) describes the transport of energy – in the form of heat – through a body of mass as the result of a temperature gradient (see fig. 1). According to the second law of thermodynamics, heat always flows in the direction of the lower temperature.thermal conductivity and thermal resistance of rigid and higher Thermal ConductivityThermal conductivity (λ with the unit W/(m•K)) describes the transport of energy – in the form of heat – through a body of mass as the result of a temperature gradient (see fig. 1). According to the second law of thermodynamics, heat always flows in the direction of the lower temperature.thermal conductivity (>1 W/(m.K)) building materials – even with rough surfaces. It was shown that accurate surface temperature measurements can be achieved by using additional thermocouples and compliant sheets between the plates and the sample. The small deviation between the GHP and HFM test results already indicates the high performance capability of both methods.