27.11.2019 by Milena Riedl
Digitalizing DSC: Get the most out of your measurements!
Thermal analysis answers many questions in different business divisions of the manufacturing industry. However, getting the most information out of the measurements is often difficult as in literature only single values and not complete thermograms are available. Polymer databases are common tools for other methods like FT-IR or GC-MS. Learn how the database for thermal analysis instrumentation facilitates your daily work.
Thermal analysis can answer many questions in different business divisions of the manufacturing industry. For incoming goods inspection, it is important to know if a material batch is suitable to produce good parts. In reverse engineering, questions arise about why a competitor can offer similar parts at cheaper prices. Once a part fails, it is necessary to detect if there are any impurities in the material or if the production parameters have been set appropriately.
Why do we need a polymer database?
Databased evaluations of results have been common for many methods like FT-IR or GC-MS for a long time. In literature, only single values and not the complete thermograms are available, which are necessary to gain complete information about a material. Additionally, the mathematical comparison of complete curves has not been possible before the digitalization of thermograms and tables.
How does it work?
Case 1: The material was a PP recycling material. The parts from the current production batch show lower mechanical properties. They also have brownish streaks that are partially visible. Earlier production batches showed no problems.
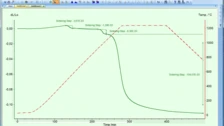
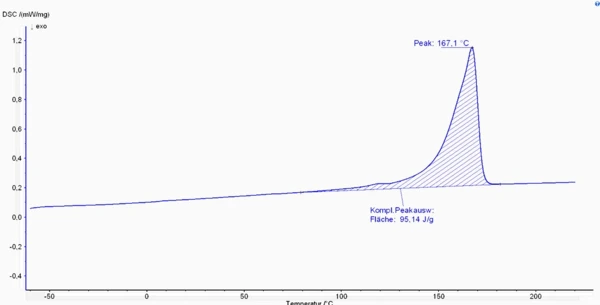
First, a good part was analyzed with differential scanning calorimetry (DSC) to have a reference to compare to the faulty part. Figure 1 illustrates that there is only one single melting peak in the typical range of polypropylene (PP).
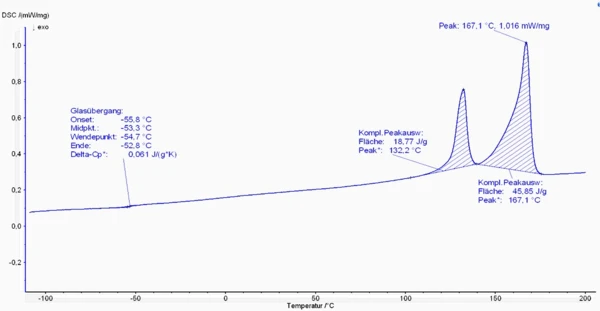
Next, the faulty part was also measured with DSC. In figure 2, it is clearly visible that there is a second melting peak at around 132°C. This is a strong indication of an impurity in the processed material.
In order to find out what the impurity is, it is necessary to look into literature …
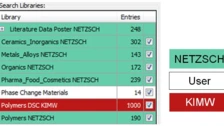
… or the polymer database integrated into the NETZSCH Proteus® software solution!
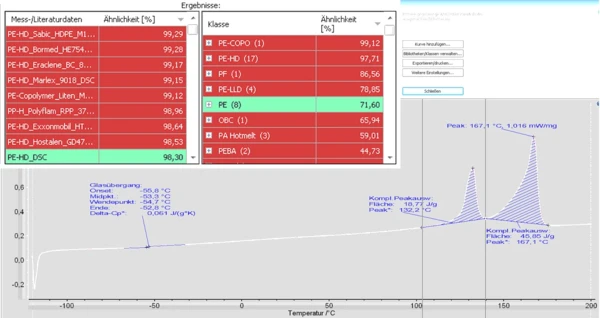
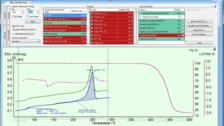
Only the measurement area with the uncommon peak was selected for the analysis. The software automatically shows reference materials that are in accordance with the measured material. In this case, the first peak has a very good correlation with HD-PE. Therefore, it can be confirmed that the recycled PP material has been contaminated with HD-PE.
Identify unknown materials
Case 2: In the second example, it was aimed to determine which material was used for the production of a competitive part.
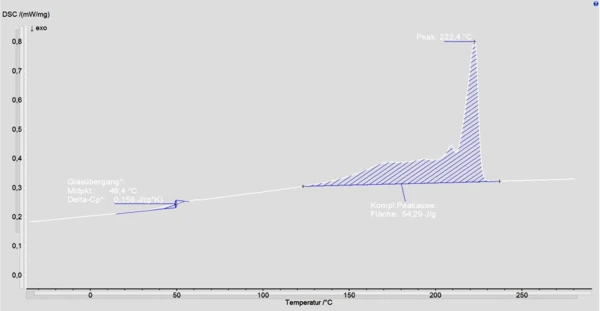
Figure 4 shows the DSC analysis of the sample with a measured melting peak of 222°C. A look into literature reveals that the material can either be polyamide 6 (PA6) (melting peak between 220 and 230°C) or PA610 (melting peak between 210 to 230°C). Thus, due to overlapping melting points, it is not possible to differentiate between the two materials.
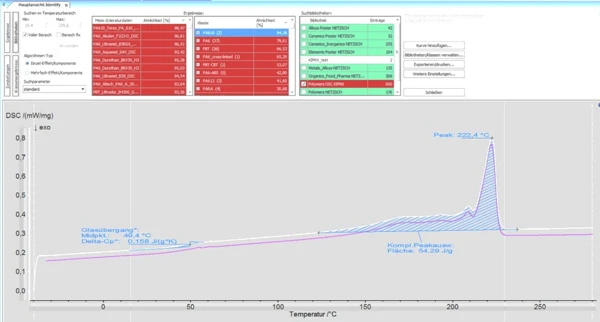
However, by evaluating the measurement with the automated database, it becomes clear that the processed material is PA610. The software compares the entire plot mathematically, compared to the single value comparison with literature data.
Your success with smart data
Digitalization of the DSC with the Proteus® software tools AutoEvaluation and Identify offers a wide range of benefits:
- Identification of material mixtures and impurities
- Improvement of quality and capacity
- Identification of unknown materials
- Higher reproducibility of measurements
Click here to get more information on the KIMW database of polymers!
Thanks to Martin Doedt (B. Sc., Head of Laboratory, Kunststoff-Institut Lüdenscheid) for the talk at K-show 2019!
