10.01.2024 by Dr. Alexander Schindler
The KIMW Polymer Database for DSC: Its Content Has Doubled Now!
The Differential Scanning Calorimetry (DSC) technique is widely-used in the polymer field for the characterization of raw materials and finished products. Typical DSC applications are, for example, quality control of incoming goods, failure analysis of broken plastic parts or identification of unknown components and impurities.
A significantly faster and much more meaningful interpretation of DSC measurements can be done involving smart software solutions such as intelligent comparisons of test results with database measurements. The database serves as a collection of results and, in addition, as a pool of suitable measurement conditions for the preparation of future tests.
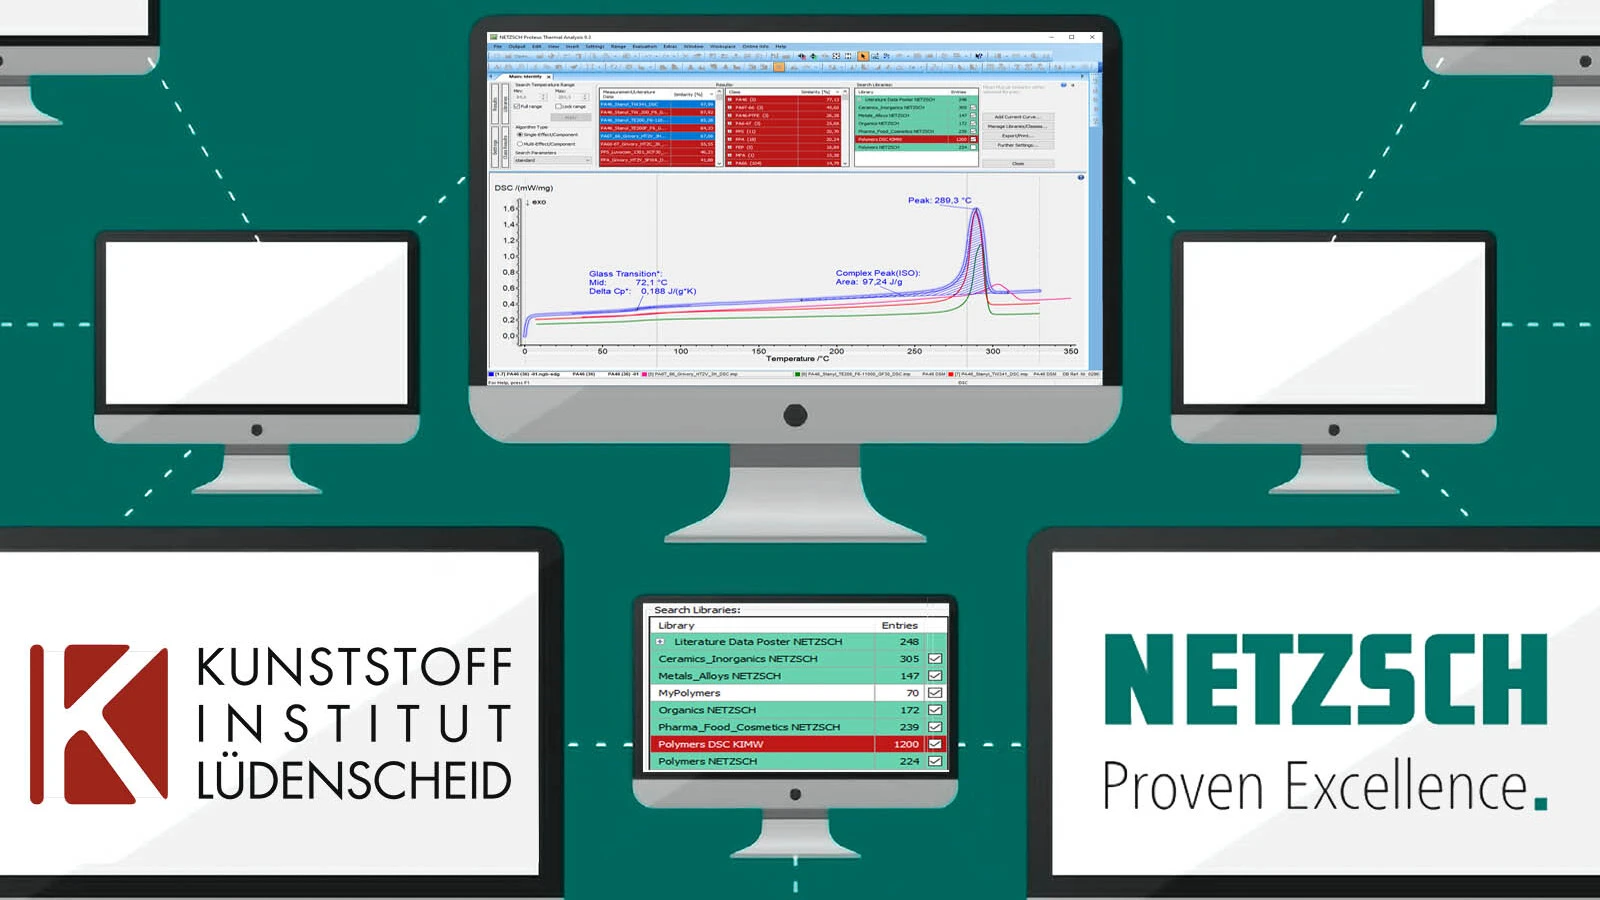
With the latest update to version 1.5, the KIMW polymer database, which was developed by the Kunststoffinstitut Lüdenscheid, Germany, contains evaluated DSC measurements on 1200 different commercially available polymers. This is already twice the number compared to the first publication of this database in 2016! The 1200 different polymer data, which include trade names, suppliers, filler contents and colors, cover 172 different polymer types: A huge amount of polymer knowledge!
Applying the KIMW Database
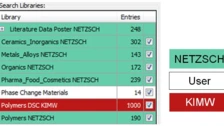
The KIMW polymer database is an optional expansion of Identify, the unique database system in thermal analysis that is part of the NETZSCH Proteus® analysis software. Shown in figure 1 are all NETZSCH libraries for various application areas: ceramics, inorganics, metals, alloys, organics, pharma, food, cosmetics and polymers.
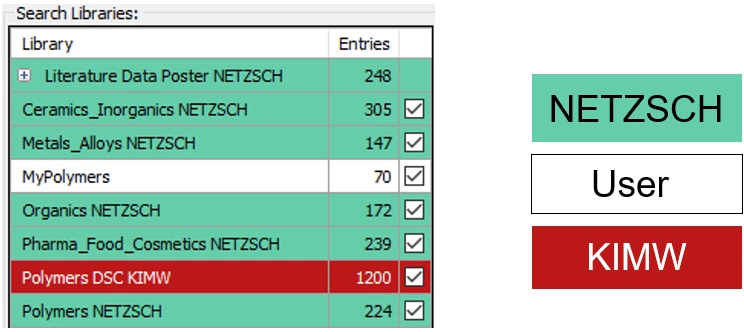
Note that in addition to DSC data, the Identify libraries cover also signals of type TGA, STA, TGA-c-DTA®, cp, DIL, TMA and DMA that can be accessed and easily overlaid. And Identify does not only contain measurements, but also a great variety of literature data, which in most cases include several material properties (Tg, Tm, mass changes, α, cp, E’) at once!
Of course, users can also build up their own Identify libraries (in the example above: “MyPolymers”) and share them with other colleagues on the computer network!
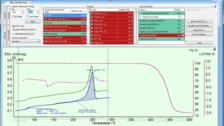
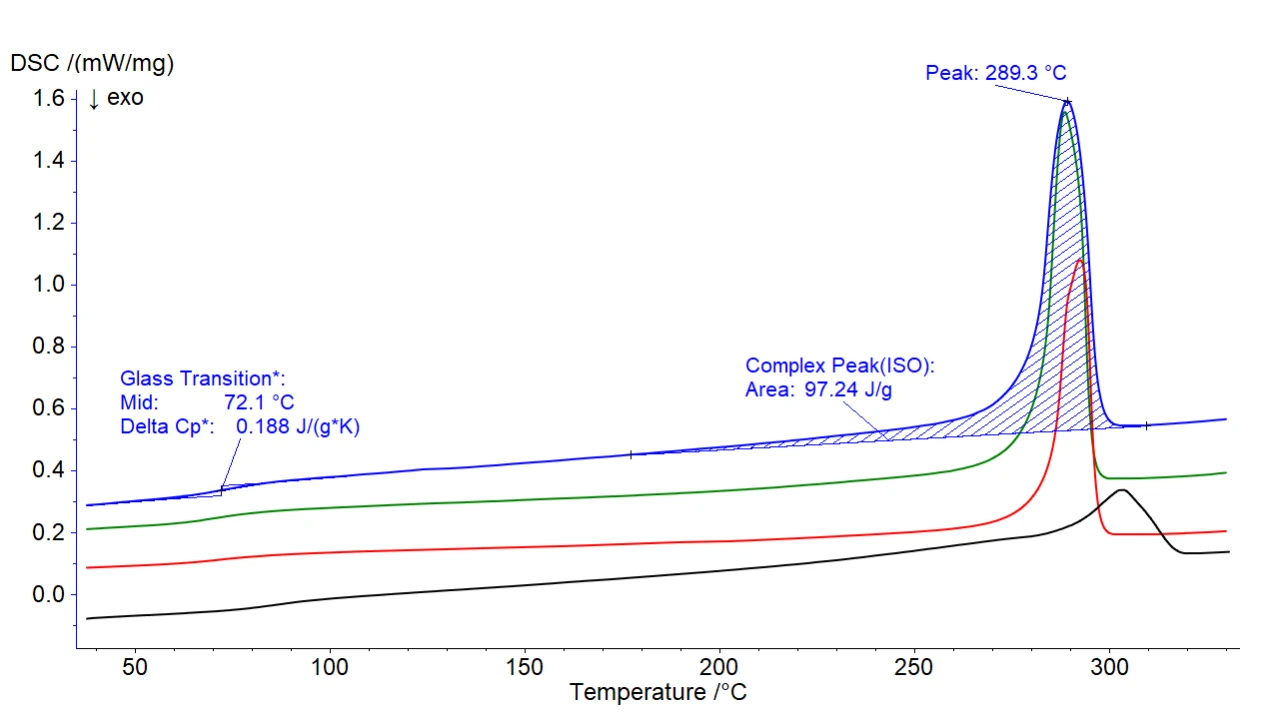
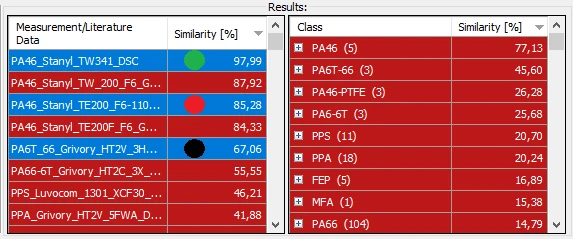
Figures 2a and 2b display an example of a database search using Identify together with the KIMW polymer library. A DSC measurement on an unknown polymer was first autonomously evaluated by AutoEvaluation and then used as an input curve for the database search. The most similar database entry (best hit) was a measurement on a particular polyamide 46 (PA46) product and the most similar polymer type was PA46, too. All other 171 polymer types present in the database can be excluded, so that the unknown polymer was identified with high probability and reliability as PA46.
At the end of a conclusive investigation of materials, any data such as evaluation results, measurement conditions, graphics and also Identify results can easily be embedded in a customizable document using the report generator − another helpful feature of Proteus® analysis.
Please find more information about Identify in an earlier blog article and the links therein.
To learn more about the KIMW database, visit our website:
