Glossaire
Mullins Effect
The Mullins effect describes a phenomenon typical for rubber materials.
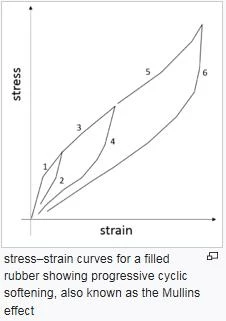
If a ContrainteLa Contrainte est définie par un niveau de force appliquée sur un échantillon d’une section bien définie. (Contrainte = force/surface). Les échantillons qui possèdent une section rectangulaire ou circulaire peuvent être comprimés ou étirés. Les matériaux élastiques comme les élastomères peuvent être étirés jusqu’à 5 à 10 fois leur longueur initiale.stress-strain curve is recorded for a strip sample, by means of a program such as the Universal Test Program of the NETZSCH DMA Eplexor®®, the so-called Mullins effect ‒ not to be confused with the Payne effect ‒ can be observed.
When does the Mullins effect occur?
Expansion of the sample at a constant deformation rate ‒ for example, from the starting point to the end point of curve 3 (figure 1) ‒ results in an increase in stresswithin this interval. If the deformation is stopped at the end of curve 3 and the sample “returns” to its initial state at the same deformation rate, the stress takes a different course (curve 4).
If the sample is thereafter expanded again (at the same deformation rate as before), then by the end of curve 5 an “intriguing” behavior can be seen, described by the Mullins effect:
With increasing strain, the stress first runs along curve 4 and then follows the course of curve 5 until the end point of course 5. Reversing the strain rate again leads to yet another new course for the stress, described in this example by curve 6.
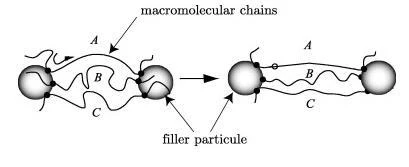
What is happening, though, on a molecular level?
If a tensile or strip specimen is subjected to macroscopic strains, the cross-linked polymer chains within the material will be “stretched“ (figure 2).
Macroscopically, the samples are thereby significantly elongated.
Fillers such as carbon black, which form so-called “clusters“ within the polymer network, break apart and thus reduce their mechanical resistance to the deformation applied. In the so-called “virgin” state, for mechanically unstressed samples ‒ i.e., the unstressed polymer network and unstressed “clusters” ‒ material stiffness is high.
Accordingly high force or stress is required to pull the sample apart (curve 3). This partial destruction of the “cluster” is the reason why the force required during the unloading cycle (curve 4) is considerably lower. If the load direction is reversed again as describe above, the stress-strain curve initially runs along curve 4.
All cluster structures which have been destroyed by the time the end point of curve 3 has been reached within the first run, remain, of course, destroyed.
That is why the stress-strain diagram follows the curve of segment 4 again. It is only a continued increase in the strain, again in connection with continued increase in the force, that leads to a repeat in partial destruction and further breaks apart the clusters that still exist.
The size of the clusters that are subjected to destruction continues to decrease with increasing strain. First, of course, the large “clusters”, which are still present in the sample in a “virgin” state at the beginning of the stress-strain test, are subjected to destruction during the experiment. Only at higher levels of strain do the smaller clusters also experience further partial destruction.