Introduction
Over the years, the Kunststoff-Institut Lüdenscheid [1] – an experienced contact for any question regarding plastics – has built up a materials database which currently contains DSC curves for more than 600 commercially available polymers. Thanks to collaboration between the Kunststoff- Institut and NETZSCH-Gerätebau GmbH, this extensive database has now been integrated into the Identify curve identification software within Proteus® analysis. In conjunction with AutoEvaluation’s automatic, user-independent evaluation of DSC measurements, this not only simplifies polymer analysis with regard to such issues as identification, failure analysis and quality control, but also makes the results more meaningful [2].
What Does Identify Offer?
The Identify database system was introduced for direct comparison and thus classification and interpretation of DSC curves, but can now also be employed for ΔL/L0 measurements stemming from DIL and TMA instruments), for cp-data from DSC instruments and, most recently, also for TGA measurements [3]. Once Identify is available within Proteus®, it can automatically be used for all signal types of any of the supported instruments. The user always has access to the entire database with all of its possibilities, such as overlaying of the current measurement curve with any database curves – including those of different data types.
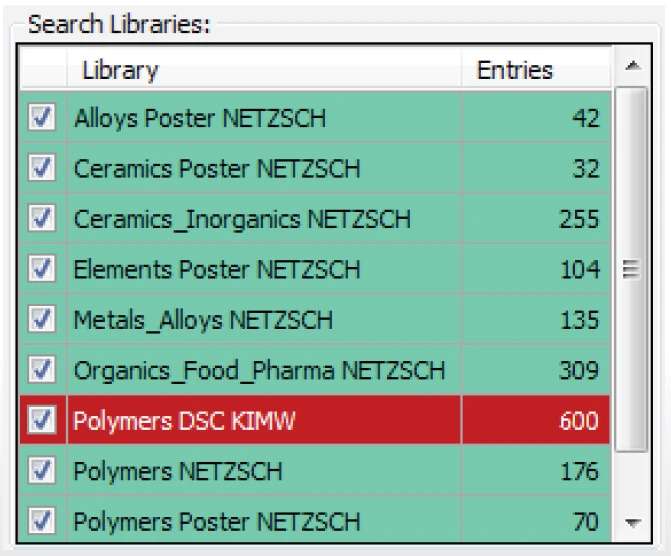
The entire NETZSCH part of the database comprises more than 1,100 entries from the fields of polymers, organics, food and pharma, ceramics and inorganics, and metals and alloys as well as chemical elements (see figure 1). These entries are composed of measurements and literature data of different data types (DSC, TGA, DIL/TMA and Specific Heat Capacity (cp)Heat capacity is a material-specific physical quantity, determined by the amount of heat supplied to specimen, divided by the resulting temperature increase. The specific heat capacity is related to a unit mass of the specimen.cp). Users can, of course, create or expand libraries with their own measurements and literature data, and these can simultaneously be shared with other users via the computer network.
Basically, Identify offers different search algorithms; the database search can be limited to certain temperature ranges and the results can be filtered according to various criteria, such as the measurement conditions.

The Advantages of the KIMW Database
While the NETZSCH part of the Identify database forms a solid foundation due to its large variety of materials and methods, the optional KIMW part additionally features previously unachieved depth in the area of DSC on polymers: It includes 600 DSC measurements on different commercially available polymers and blends, reflecting about 130 different polymer types. This means that for many polymer types there are measurements on different products of the same type present which may exhibit significantly different DSC profiles. In addition to the multitude of DSC curves, there is the advantage that for each of the 600 polymers, the exact trade name and manufacturer are stored, along with color and filler content.
In summary, their integration into Identify allows the 600 DSC curves of the KIMW database to be used directly and intelligently – either via a purely visual comparison or for automatic identification of a polymer as shown with the following example.
Identification of a Polymer Blend
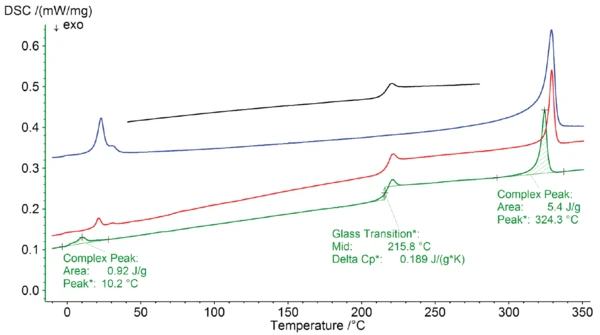
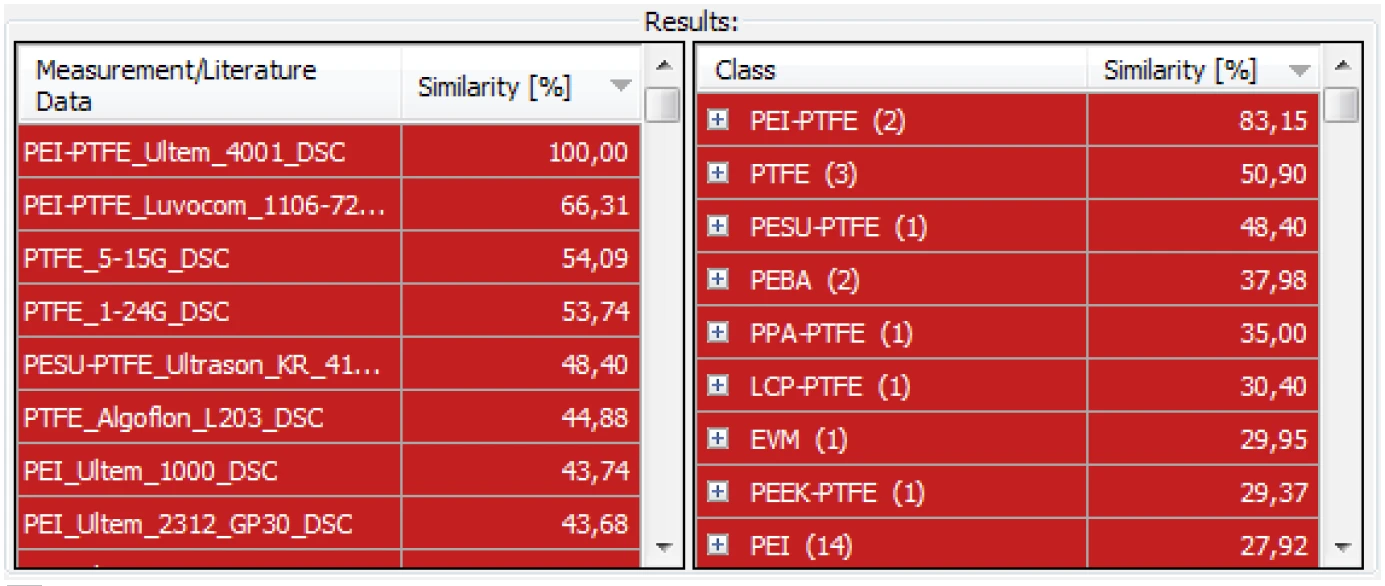
Figures 2a and 2b illustrate an exemplary database search where a measurement on the polymer blend “PEI-PTFE Ultem 4001”, which is already available in the KIMW database, serves as an input curve. The AutoEvaluation and Identify results appear with a single click: First, automatic detection and evaluation of the effects were carried out; in this case, an EndothermicA sample transition or a reaction is endothermic if heat is needed for the conversion.endothermic effect was found in the temperature range between approximately 0°C and 30°C, as well as a Glass Transition TemperatureThe glass transition is one of the most important properties of amorphous and semi-crystalline materials, e.g., inorganic glasses, amorphous metals, polymers, pharmaceuticals and food ingredients, etc., and describes the temperature region where the mechanical properties of the materials change from hard and brittle to more soft, deformable or rubbery.glass transition at approximately 216°C and another EndothermicA sample transition or a reaction is endothermic if heat is needed for the conversion.endothermic (melting) effect at a peak temperature of 324°C. The database search yielded the same curve as the most similar hit along with another PEI-PTFE blend, but also measurements on pure PTFE and PEI (see figure 2b).
In contrast, the DSC curves of most of the other polymer types had a much lower similarity so that they could be ruled out. For more details such as measurement conditions or interpretation of the effects, please see reference [2].


Summary
The KIMW database integrated into Identify allows for direct comparison of a measurement with many hundred DSC curves on commercially available polymers. This makes polymer identification not only easier, but also more reliable!