Introduzione
Nel corso degli anni, il Kunststoff-Institut Lüdenscheid [1] - un contatto esperto per qualsiasi domanda sulle materie plastiche - ha costruito un database di materiali che attualmente contiene le curve DSC di oltre 600 polimeri disponibili in commercio. Grazie alla collaborazione tra il Kunststoff- Institut e NETZSCH-Gerätebau GmbH, questo ampio database è stato integrato nel software di identificazione delle curve all'interno dell'analisi Proteus®. Insieme alla valutazione automatica e indipendente dall'utente delle misure DSC di AutoEvaluation, questo non solo semplifica l'analisi dei polimeri per quanto riguarda l'identificazione, l'analisi dei guasti e il controllo di qualità, ma rende anche i risultati più significativi [2].
Cosa offre Identify?
Il sistema di database Identify è stato introdotto per il confronto diretto e quindi la classificazione e l'interpretazione delle curve DSC, ma ora può essere utilizzato anche per le misure ΔL/L0 derivanti da strumenti DIL e TMA), per i dati Capacità termica specifica (cp)La capacità termica è una grandezza fisica specifica del materiale, determinata dalla quantità di calore fornita al campione, divisa per l'aumento di temperatura risultante. La capacità termica specifica è correlata all'unità di massa del campione.cp degli strumenti DSC e, più recentemente, anche per le misure TGA [3]. Una volta che Identify è disponibile all'interno di Proteus®, può essere utilizzato automaticamente per tutti i tipi di segnale di qualsiasi strumento supportato. L'utente ha sempre accesso all'intero database con tutte le sue possibilità, come la sovrapposizione della curva di misura corrente con qualsiasi curva del database, comprese quelle di tipi di dati diversi.
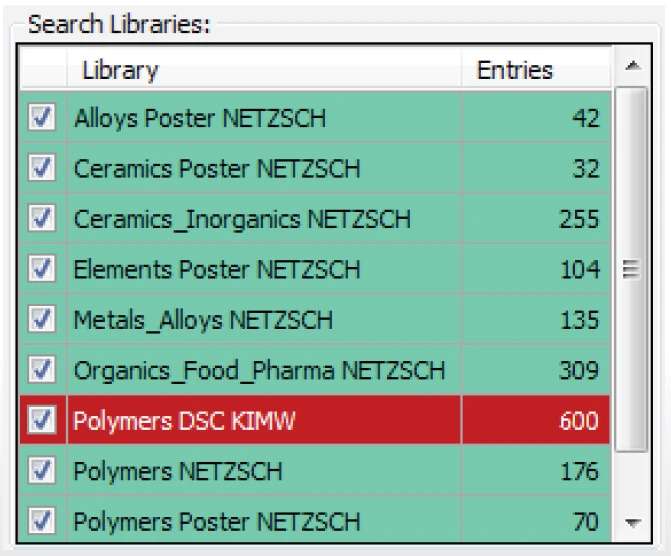
L'intera parte del database NETZSCH comprende più di 1.100 voci relative ai settori dei polimeri, dell'organica, dell'alimentare e del farmaceutico, della ceramica e dell'inorganica, dei metalli e delle leghe e degli elementi chimici (vedi figura 1). Queste voci sono composte da misure e dati di letteratura di diversi tipi di dati (DSC, TGA, DIL/TMA e Capacità termica specifica (cp)La capacità termica è una grandezza fisica specifica del materiale, determinata dalla quantità di calore fornita al campione, divisa per l'aumento di temperatura risultante. La capacità termica specifica è correlata all'unità di massa del campione.cp). Gli utenti possono naturalmente creare o ampliare il sito libracon le proprie misurazioni e i propri dati di letteratura, che possono essere condivisi con altri utenti attraverso la rete di computer.
Fondamentalmente, Identify offre diversi algoritmi diarch; il databasearch può essere limitato a determinati intervalli di temperatura e i risultati possono essere filtrati in base a vari criteri, come le condizioni di misurazione.
I vantaggi del database KIMW
Mentre la parte NETZSCH del database Identify costituisce una solida base grazie alla sua large varietà di materiali e metodi, la parte opzionale KIMW presenta inoltre una profondità mai raggiunta prima nel campo della DSC sui polimeri: Include 600 misure DSC su diversi polimeri e miscele disponibili in commercio, che riflettono circa 130 tipi di polimeri diversi. Ciò significa che per molti tipi di polimeri sono presenti misure su diversi prodotti dello stesso tipo che possono presentare profili DSC significativamente diversi. Oltre alla moltitudine di curve DSC, c'è il vantaggio che per ognuno dei 600 polimeri sono memorizzati il nome commerciale e il produttore esatto, oltre al colore e al contenuto di riempitivo.
In sintesi, la loro integrazione in Identify consente di utilizzare direttamente e in modo intelligente le 600 curve DSC del database KIMW, sia attraverso un confronto puramente visivo sia per l'identificazione automatica di un polimero, come mostrato nell'esempio seguente.
Identificazione di una miscela di polimeri
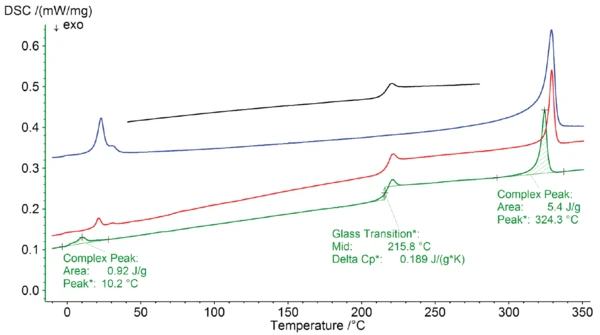
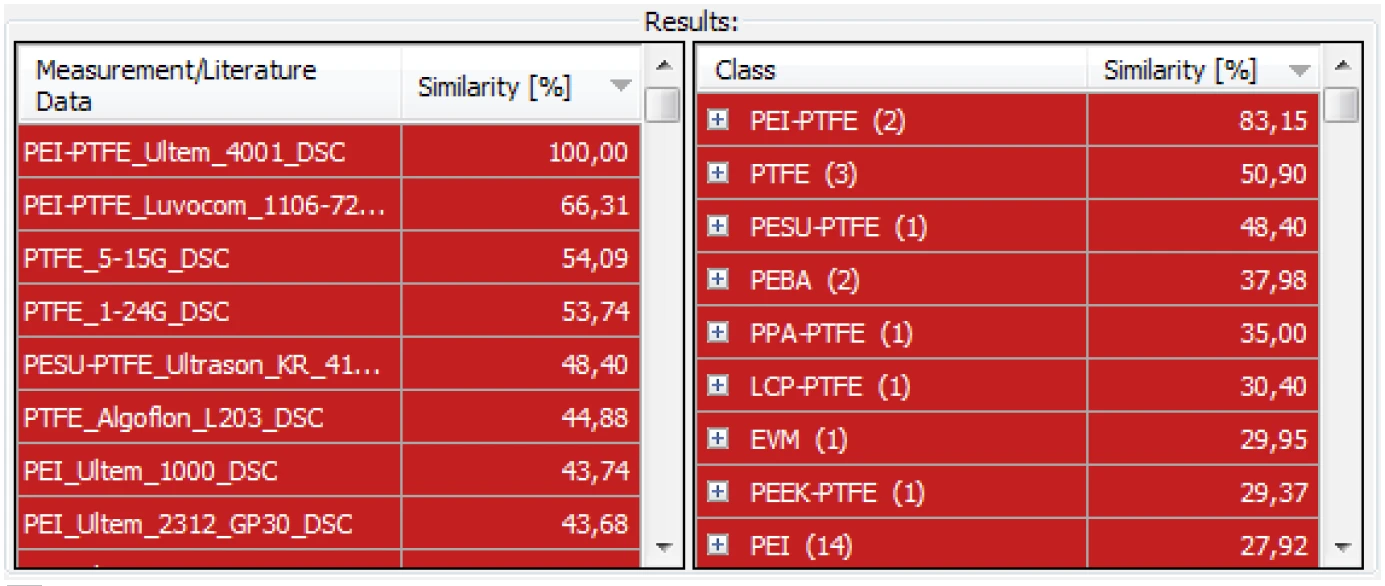
Le figure 2a e 2b illustrano un esempio di database search in cui una misura sulla miscela di polimeri "PEI-PTFE Ultem 4001", già disponibile nel database KIMW, serve come curva di ingresso. I risultati di AutoEvaluation e Identify appaiono con un solo clic: In primo luogo, sono stati effettuati il rilevamento e la valutazione automatica degli effetti; in questo caso, è stato rilevato un effetto EndotermicoUna transizione campionaria o una reazione è endotermica se per la conversione è necessario il calore.endotermico nell'intervallo di temperatura compreso tra circa 0°C e 30°C, nonché una transizione vetrosa a circa 216°C e un altro effetto EndotermicoUna transizione campionaria o una reazione è endotermica se per la conversione è necessario il calore.endotermico (di Temperature di fusione ed entalpieL'entalpia di fusione di una sostanza, nota anche come calore latente, è una misura dell'apporto di energia, tipicamente calore, necessario per convertire una sostanza dallo stato solido a quello liquido. Il punto di fusione di una sostanza è la temperatura alla quale essa cambia stato da solido (cristallino) a liquido (fusione isotropa). fusione) a una temperatura di picco di 324°C. Il database search ha prodotto la stessa curva dell'hit più simile insieme a un'altra miscela PEI-PTFE, ma anche misure su PTFE e PEI puri (vedi figura 2b).
Al contrario, le curve DSC della maggior parte degli altri tipi di polimeri avevano una somiglianza molto più bassa, tanto da poter essere escluse. Per ulteriori dettagli, come le condizioni di misurazione o l'interpretazione degli effetti, si rimanda al riferimento [2].
Sintesi
Il database KIMW integrato in Identify consente di confrontare direttamente una misura con molte centinaia di curve DSC di polimeri disponibili in commercio. Questo rende l'identificazione del polimero non solo più facile, ma anche più affidabile!