Introduction
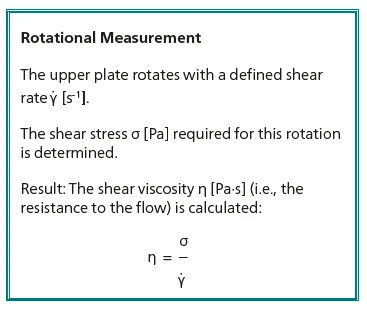
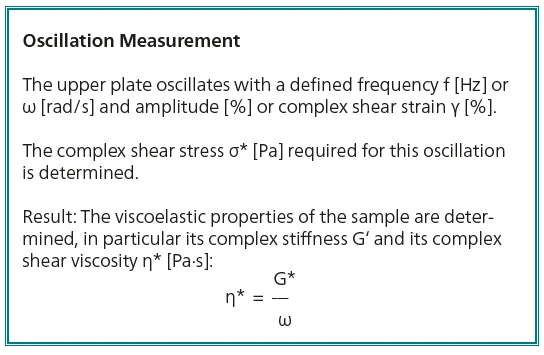
A rotational rheometer can make measurements under defined shear rates or stresses in both viscometry (where the upper plate rotates) and in oscillation (where the upper plates oscillates at a specified frequency). While shear viscosity is often the most commonly desired result from a rotational experiment, the oscillation test delivers information about the visco-elastic properties of the sample, particularly its complex viscosity (ŋ*) obtained from its complex stiffness (G*)[1].
In the following, polypropylene was measured using both viscometry and oscillation and the shear viscosity (ŋ) was compared with its complex viscosity (ŋ*).
Table 1: Test parameters of the rotational measurement
| Device | Kinexus ultra+ with electrically heated chamber | |
| Geometry | CP2/20 (Cone-Plate, angle: 2°, diameter: 20 mm) | |
| Temperature | ||
| Measurement gap | 66 μm | |
| Shear rates (·γ) | 0.01 to 10 s-1 | |
Rotational Measurement on Polypropylene
A rotational measurement was carried out on polypropylene pellets using the NETZSCH Kinexus ultra+ rheometer. Table 1 details the measurement conditions.
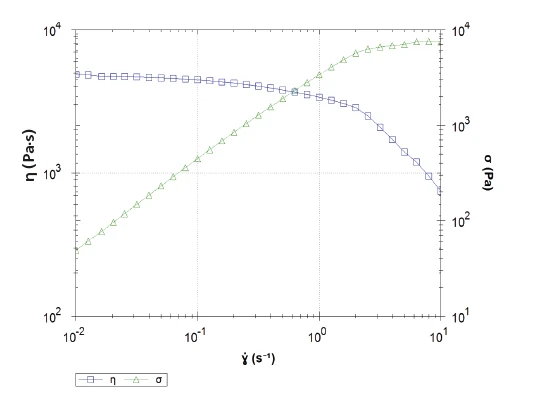
Figure 1 displays the resulting curves of the shear StressStress is defined as a level of force applied on a sample with a well-defined cross section. (Stress = force/area). Samples having a circular or rectangular cross section can be compressed or stretched. Elastic materials like rubber can be stretched up to 5 to 10 times their original length.stress (σ, green) and the shear viscosity (ŋ, blue) for the programmed shear rates. In the low shear rate range, the increase in shear StressStress is defined as a level of force applied on a sample with a well-defined cross section. (Stress = force/area). Samples having a circular or rectangular cross section can be compressed or stretched. Elastic materials like rubber can be stretched up to 5 to 10 times their original length.stress with increasing shear rates is linear and the shear viscosity is almost constant: This is the Newtonian plateau of the material.
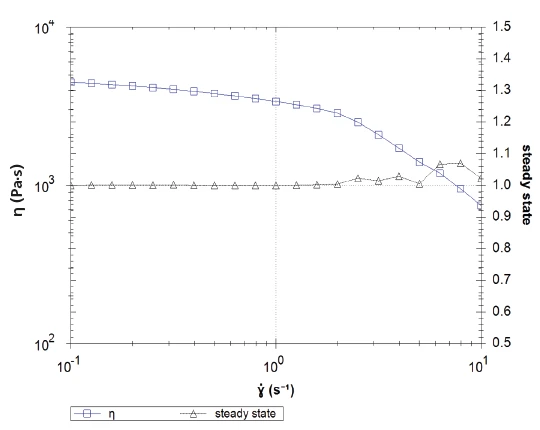
Around 0.1 s-1, the shear viscosity begins to decrease with increasing shear rates. The slope changes; this is an indication of more pronounced Shear ThinningThe most common type of non-Newtonian behavior is shear thinning or pseudoplastic flow, where the fluid viscosity decreases with increasing shear.shear-thinning behavior. However, a look at the steady-state curve (which is an indication for time-independent flow within the sample, Figure 2, black) shows that above this shear rate, the flow is no longer time-independent. It is ensured that the measurement leads to correct shear viscosity values by checking the steady-flow values: They amount to 1 for a laminar, time-independent flow. Here, the curve increase proves that the shear viscosity values displayed are no longer reliable in the last decade.
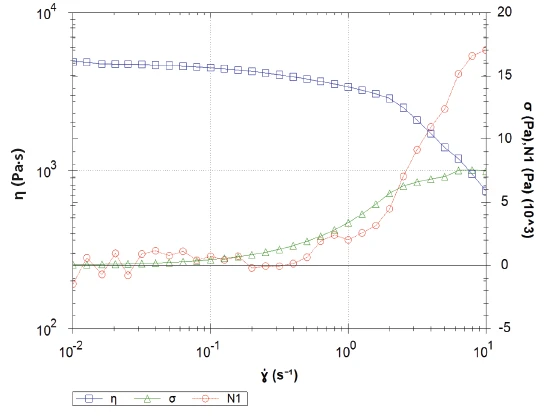
Where does this behavior come from? A look at Figure 3 provides the answer. Additional to the shear viscosity (blue), the shear StressStress is defined as a level of force applied on a sample with a well-defined cross section. (Stress = force/area). Samples having a circular or rectangular cross section can be compressed or stretched. Elastic materials like rubber can be stretched up to 5 to 10 times their original length.stress (green) is plotted along with the first normal StressStress is defined as a level of force applied on a sample with a well-defined cross section. (Stress = force/area). Samples having a circular or rectangular cross section can be compressed or stretched. Elastic materials like rubber can be stretched up to 5 to 10 times their original length.stress difference (N1, red). The strong increase in the first normal StressStress is defined as a level of force applied on a sample with a well-defined cross section. (Stress = force/area). Samples having a circular or rectangular cross section can be compressed or stretched. Elastic materials like rubber can be stretched up to 5 to 10 times their original length.stress difference, N1, most probably results from the Weissenberg effect: The elastic properties of the sample dominate the viscous properties. The sample attempts to push up the upper geometry (this is not possible because the measurement gap remains constant during the measurement). This effect is highlighted by the N1 curve exceeding the shear StressStress is defined as a level of force applied on a sample with a well-defined cross section. (Stress = force/area). Samples having a circular or rectangular cross section can be compressed or stretched. Elastic materials like rubber can be stretched up to 5 to 10 times their original length.stress curve.
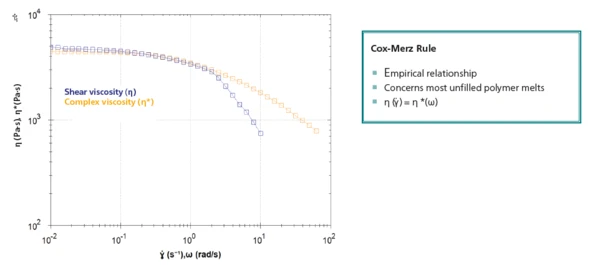
How to Obtain Shear Viscosity Values: The Cox-Merz Rule
In such cases, where the shear viscosity curve cannot be evaluated properly, the Cox-Merz rule [2] is very useful. It is an empirical relationship stating that for most polymer melts, the shear viscosity (η) as a function of the shear rate (·γ [s-1]) is equal to the complex viscosity (η* [Pa·s]) as a function of the angular frequency (ω [rad/s]). This second curve is obtained by an oscillation measurement in which the frequency is varied (frequency sweep).
First, an amplitude sweep is performed in order to determine the StrainStrain describes a deformation of a material, which is loaded mechanically by an external force or stress. Rubber compounds show creep properties, if a static load is applied.strain to be used during the frequency sweep. The deformation applied on the polymer has to be low enough not to lead to a breakdown of the sample structure. In other words, the StrainStrain describes a deformation of a material, which is loaded mechanically by an external force or stress. Rubber compounds show creep properties, if a static load is applied.strain selected must be in the linear viscoelastic range (Linear Viscoelastic Region (LVER)In the LVER, applied stresses are insufficient to cause structural breakdown (yielding) of the structure and hence important micro-structural properties are being measured.LVER) of the sample, where StrainStrain describes a deformation of a material, which is loaded mechanically by an external force or stress. Rubber compounds show creep properties, if a static load is applied.strain and StressStress is defined as a level of force applied on a sample with a well-defined cross section. (Stress = force/area). Samples having a circular or rectangular cross section can be compressed or stretched. Elastic materials like rubber can be stretched up to 5 to 10 times their original length.stress are related by a linear relationship.
Table 2 details the conditions of the oscillation measurements performed on polypropylene.
Figure 4 displays the resulting curves of the elastic, loss moduli and phase angle as a function of deformation (Figure 4A) and the corresponding shear stress (Figure 4B). At the beginning of the measurement, the elastic and viscous moduli remain constant: This indicates that the applied deformation does not destroy the sample structure. However, from a shear StrainStrain describes a deformation of a material, which is loaded mechanically by an external force or stress. Rubber compounds show creep properties, if a static load is applied.strain of 20%, an increase in amplitude leads to a decrease in both moduli, while the phase angle increases. In accordance with ISO 6721-10, the end of Linear Viscoelastic Region (LVER)In the LVER, applied stresses are insufficient to cause structural breakdown (yielding) of the structure and hence important micro-structural properties are being measured.LVER is determined at the amplitude leading to a decrease of 5% in the G´ value. In this case, it corresponds to a value of 32%.
Table 2: Test parameters of the oscillation measurements
Amplitude Sweep | Frequency Sweep | |
| Device | Kinexus ultra+ with electrically heated chamber | |
| Geometry | PP25 (plate-plate, diameter: 25 mm) | PP25 |
| Temperature | ||
| Measurement gap | 1 mm | 1 mm |
| Frequency | 1 Hz | 10-3 to 10 Hz |
| Shear StrainStrain describes a deformation of a material, which is loaded mechanically by an external force or stress. Rubber compounds show creep properties, if a static load is applied.strain (γ*) | 1 to 100% | - |
| Shear stress (σ*) | - | 1,000 Pa |
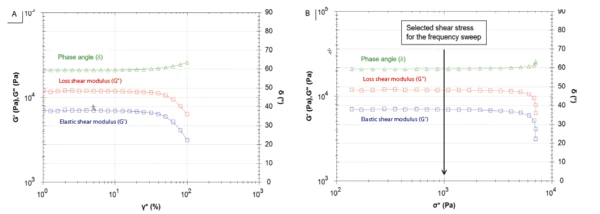
The curves obtained during the amplitude sweep can also be displayed as a function of shear stress (Figure 4B). For the subsequent frequency sweep, a shear stress of 1000 Pa was applied to the sample.
Figure 5 depicts the shear viscosity from the rotational measurement (blue) along with the complex viscosity from the frequency sweep (orange). Both curves are in good agreement between 10-2 and 2 rad/s. This confirms Conclusion The shear viscosity and complex viscosity of a polypropylene melt were compared by means of a rotational and an oscillation measurement. As long as a steady flow can be applied to the polymer, good agreement between the shear viscosity and complex viscosity could be demonstrated. This behavior is expected from the Cox-Merz rule. For higher shear rates, where flow instabilities occur, a steady flow is no longer reached. Here, the Cox-Merz rule is of great use because it reveals knowledge of the shear viscosity using the complex viscosity. Shear viscosity (η, blue) and complex viscosity (η*, orange) during the rotational and oscillation measurements on molten polypropylene melts 5 the results discussed above: The flow instabilities occurring at higher shear rates prevent the flow from being time-independent. Consequently, no reliable results can be obtained with the rotational measurement. However, applying Cox-Merz allows for easy determination of the steady-state shear viscosity: One just needs to obtain the complex viscosity as a function of the angular frequency after having carried out an oscillation measurement.
Conclusion
The shear viscosity and complex viscosity of a polypropylene melt were compared by means of a rotational and an oscillation measurement. As long as a steady flow can be applied to the polymer, good agreement between the shear viscosity and complex viscosity could be demonstrated. This behavior is expected from the Cox-Merz rule. For higher shear rates, where flow instabilities occur, a steady flow is no longer reached. Here, the Cox-Merz rule is of great use because it reveals knowledge of the shear viscosity using the complex viscosity.