Introduction
Many products during processing will alter their material properties according to changes in temperature and time. Starch-based products exhibit a temperaturedependent viscosity profile. In order to understand and refine the processing requirements or formulation, these products can be rheologically characterized.
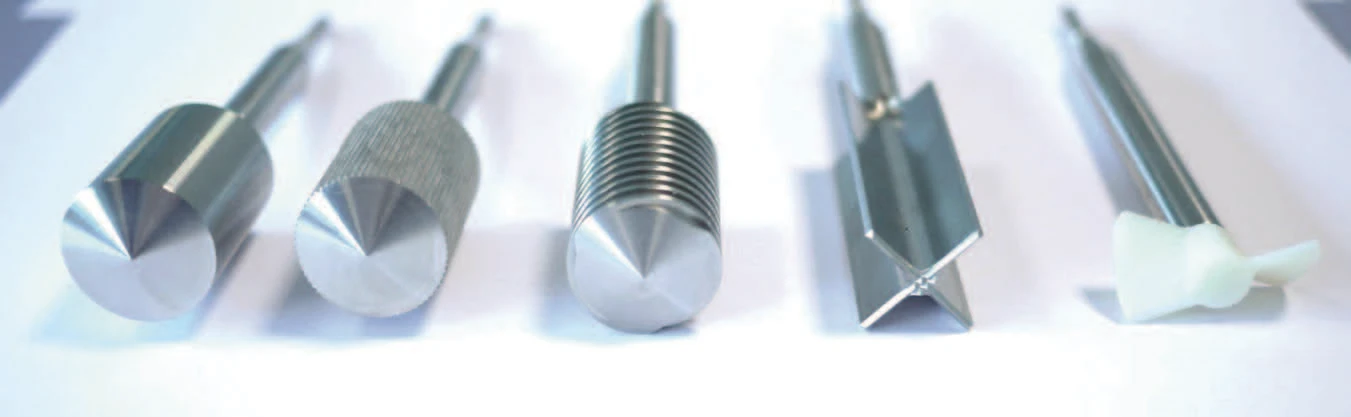
The Kinexus rotational rheometer has many different geometries suitable for characterizing a wide range of materials using a cup and bob style system. A selection of these can be seen in Figure 1. These geometries, coupled with a matching cup, are designed with surface finishes that can aid sample measurement according to sample type (for example, spiralled grooves to prevent sedimentation of particles).
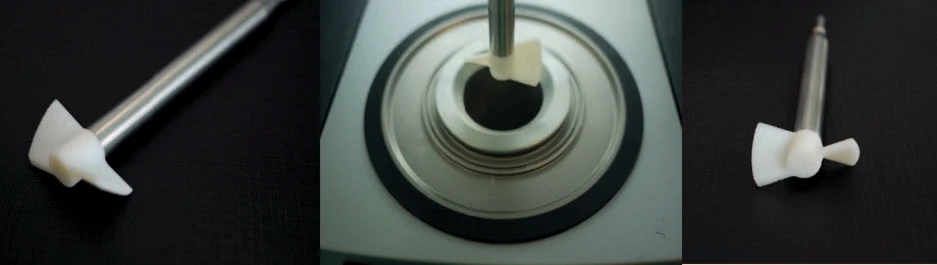
The paddle (shown in Figure 2), is a paddle used for starch pasting rheology. Although this geometry is designed for pasting rheology, it can also be utilized as a dispersion geometry, useful for preventing the rapid sedimentation of particles or separation of phases (as demonstrated in the dispersion webinar.
The Kinexus is a useful tool for determining the rheological transitions of starch with temperature. Using the built-in analysis within the software (see Figure 3), it can automatically establish the pasting temperature, the peak viscosity, the holding viscosity and the final viscosity during a change in temperature. Characterizing different starch products and establishing the above parameters provides useful information regarding changes to a sample during processing.
Experimental
The pasting rheology of starch was characterized using the starch paddle coupled with a 37 mm diameter cup and cylinder cartridge undertaken on a Kinexus rheometer. The temperature was ramped from 50 to 95 ˚C, held at 95 °C and then back down to 50 ˚C using a temperature ramp rate of 12˚C min-1 and rotational speed of 160 rpm.

Results and Discussion
Figure 4 shows the plot of viscosity and temperature with time on a standard starch sample. The corresponding starch analysis is able to indicate at what temperatures and viscosities these transitions occur and reports the values at the end of the measurement in tabulated form. Using this analysis, the different viscosities and temperatures were established for the standard starch sample (see Table 1). The pasting temperature was found to be around 78˚C, the peak viscosity; 4.4 Pa s, the holding viscosity is around 1.9 Pa s and the final viscosity was determined to be 3.7 Pa s.
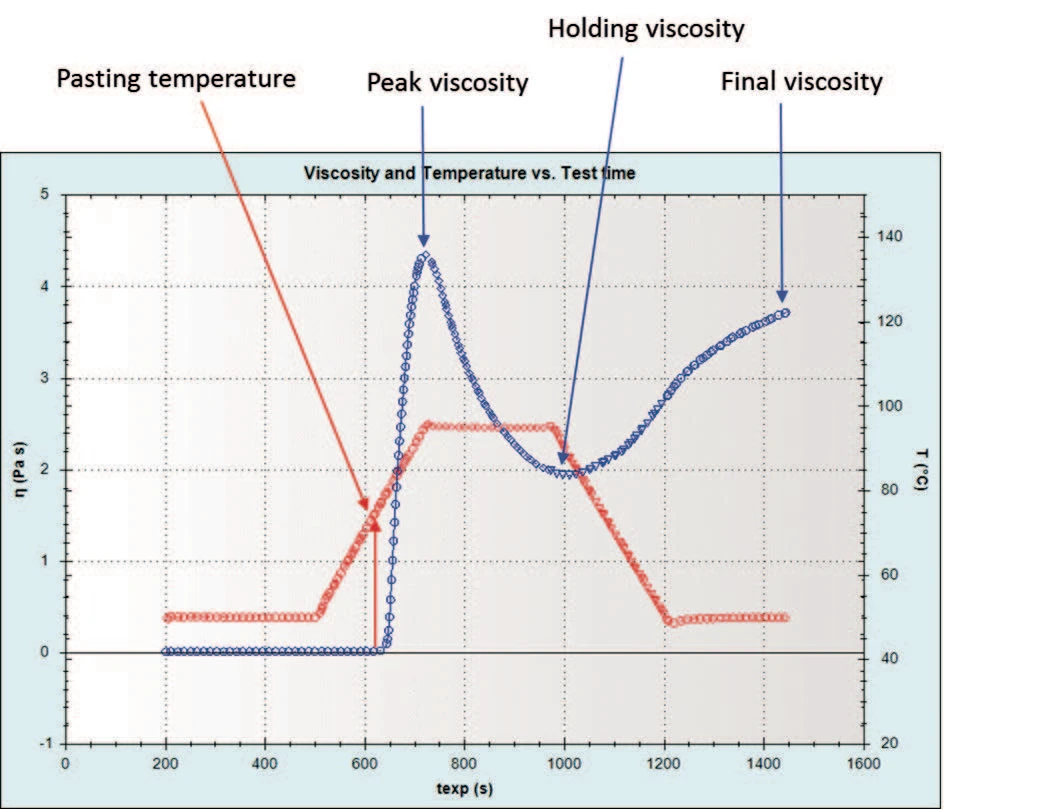
Table 1: The rheological transitions of starch as temperature is ramped from 50 up to 95˚C and back to 50˚C.
| Action name | Temperature (°C) | Shear viscostiy (Pa s) | Time (sample) (s) |
|---|---|---|---|
| Peak viscosity analysis | 95.24 | 4.35 | 534.9 |
| Final viscosity analysis | 49.97 | 3.72 | 1258 |
| Holding viscosity analysis | 89.13 | 1.94 | 816.7 |
| Pasting temperature | 78.23 | 0.04 | 450.9 |
Conclusion 1
A standard starch pasting measurement can easily be performed on a Kinexus rheometer. Using a starch paddle and starch analysis, the rheological transitions of starch can be established allowing quick and easy comparisons to be made across different samples.
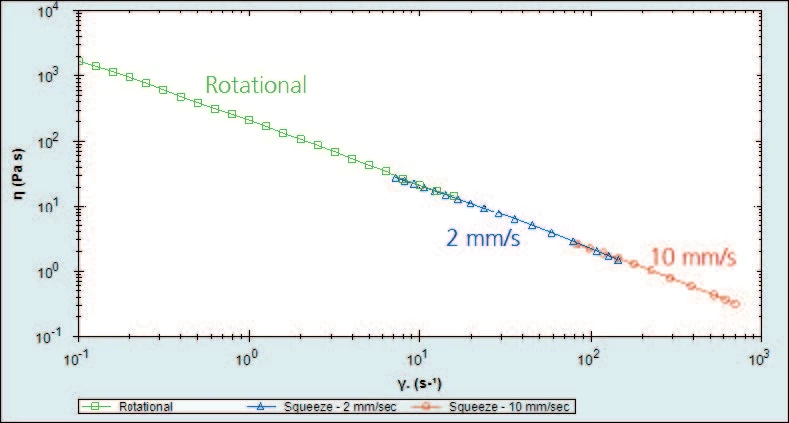
The squeeze flow test was repeated for a fresh 1 g aliquot of toothpaste and this time using a gapping speed of 10 mm/s. A comparison of both 2 and 10 mm/s data is shown in Figure 5, together with equilibrium flow data obtained using traditional rotational rheometry.
It can be seen that the squeeze flow data matches up extremely well with the rotational data, extending the shear rate from a maximum of 20 s-1 for rotational measurements, to 700 s-1 for squeeze flow measurements. Of course, different samples may be more or less suitable for the squeeze flow technique than that shown here, hence trial measurements are recommended for any new analysis.
Conclusion 2
A Kinexus rotational rheometer with advanced axial test capabilities can be used to extend the measurable shear rate range of concentrated suspensions, which are prone to fracture, by using the squeeze flow technique. Calculated viscosities for toothpaste obtained by squeeze flow measurements gave comparable data to traditional rotational rheometry and extended the shear rate range by nearly two orders of magnitude.
Footnote
[1] The size of the gap should be 10 x the size of the maximum particle so that there is enough free space between the particles for them to move freely. With increasing shear rate and a narrow gap, large particles tend to jam together, falsifying flow behavior.