Introduction
L'évaluation de la stabilité à long terme d'un produit - tel que les produits d'hygiène personnelle et les produits ménagers, les denrées alimentaires et les boissons, les peintures, les encres et les revêtements - peut être un processus à la fois fastidieux et chronophage, qui doit tenir compte des conditions environnementales que le produit est susceptible de rencontrer au cours de sa vie. Il n'est pas rare que ces produits soient exposés à des températures allant de moins de zéro à 50°C lorsqu'ils sont transportés dans des camions ou stockés dans des entrepôts. Dans ces conditions, les produits peuvent se détériorer et devenir visuellement inacceptables et/ou moins efficaces.
Afin de déterminer la stabilité à la température de ces produits, il est nécessaire de surveiller le comportement rhéologique du produit à travers un certain nombre de cycles de température. La meilleure façon d'évaluer ce comportement est de contrôler le Module complexeLe module complexe se compose de deux éléments, le module de stockage et le module de perte. Le module de stockage (ou module de Young) décrit la rigidité et le module de perte décrit le comportement d'amortissement (ou viscoélastique) de l'échantillon correspondant en utilisant la méthode de l'analyse mécanique dynamique (DMA). module complexe (G*) en fonction de la température. Un système thermiquement stable devrait présenter un comportement de cycle similaire puisque la microstructure ne devrait pas avoir changé. Pour les échantillons thermiquement instables, le Module complexeLe module complexe se compose de deux éléments, le module de stockage et le module de perte. Le module de stockage (ou module de Young) décrit la rigidité et le module de perte décrit le comportement d'amortissement (ou viscoélastique) de l'échantillon correspondant en utilisant la méthode de l'analyse mécanique dynamique (DMA). module complexe dépendra de la température à chaque cycle thermique.
Cette note d'application présente la méthodologie et les données relatives à la Stabilité thermiqueUn matériau est thermiquement stable s'il ne se décompose pas sous l'influence de la température. Une façon de déterminer la stabilité thermique d'une substance est d'utiliser un ATG (analyseur thermogravimétrique). stabilité thermique de deux formulations de crème pour la peau.
Expérimental
- La Stabilité thermiqueUn matériau est thermiquement stable s'il ne se décompose pas sous l'influence de la température. Une façon de déterminer la stabilité thermique d'une substance est d'utiliser un ATG (analyseur thermogravimétrique). stabilité thermique de deux crèmes pour la peau a été évaluée sur une plage de températures allant de 10°C à 50°.
- Les mesures au rhéomètre rotatif ont été effectuées à l'aide d'un rhéomètre Kinexus équipé d'une cartouche à plaque Peltier et d'un système de mesure à cône et à plaque1, et en utilisant des séquences standard préconfigurées dans le logiciel rSpace.
- Une séquence de chargement standard a été utilisée pour s'assurer que l'échantillon était soumis à un protocole de chargement cohérent et contrôlable.
- Un balayage d'amplitude contrôlé par la déformation est effectué pour mesurer la longueur de la Région viscoélastique linéaire (LVER)Dans le LVER, les contraintes appliquées ne sont pas suffisantes pour provoquer une rupture de la structure, ce qui permet de mesurer d'importantes propriétés micro-structurelles.région viscoélastique linéaire (LVER) et pour déterminer une valeur de déformation appropriée à utiliser dans le test de rampe de température suivant (la détermination de la Région viscoélastique linéaire (LVER)Dans le LVER, les contraintes appliquées ne sont pas suffisantes pour provoquer une rupture de la structure, ce qui permet de mesurer d'importantes propriétés micro-structurelles.LVER est automatisée dans le logiciel rSpace, et la valeur de déformation déterminée est introduite dans la partie suivante de la séquence).
- Un essai de rampe de température à fréquence unique contrôlé par déformation est effectué, la plage de température étant réglée sur les températures extrêmes qu'un produit peut rencontrer pendant le transport et le stockage - dans ce cas, de 10°C à 50°C. La température est augmentée et diminuée en fonction de l'intensité de la déformation.
- La température est augmentée et diminuée entre les limites de température fixées, le nombre de cycles de répétition étant défini en fonction des besoins.
- La Stabilité thermiqueUn matériau est thermiquement stable s'il ne se décompose pas sous l'influence de la température. Une façon de déterminer la stabilité thermique d'une substance est d'utiliser un ATG (analyseur thermogravimétrique). stabilité thermique du produit est quantifiée en comparant les tracés de G* en fonction de la température et en appliquant des statistiques de courbe pour analyser les différences dans les données pour les différents cycles afin d'évaluer l'écart des courbes par rapport aux limites fixées, par exemple une valeur de <5% de différence à chaque point de l'ensemble des données peut être considérée comme thermiquement stable, et une différence de >5% peut être considérée comme thermiquement instable, en fonction des exigences du produit.
Résultats et discussion
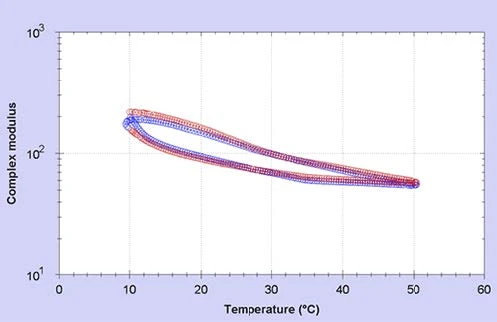
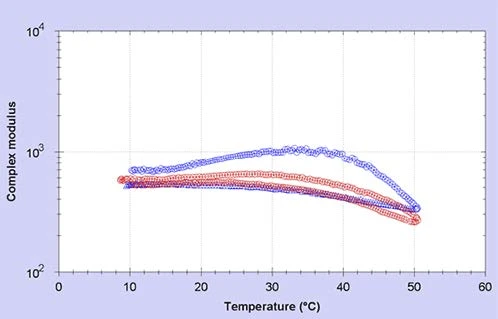
Les courbes du Module complexeLe module complexe se compose de deux éléments, le module de stockage et le module de perte. Le module de stockage (ou module de Young) décrit la rigidité et le module de perte décrit le comportement d'amortissement (ou viscoélastique) de l'échantillon correspondant en utilisant la méthode de l'analyse mécanique dynamique (DMA). module complexe en fonction de la température pour deux cycles thermiques répétés sont présentées pour l'échantillon A (voir figure 1) et l'échantillon B (voir figure 2).
Pour l'échantillon A, les courbes des deux cycles de température montrent un bon chevauchement, ce qui est confirmé par l'analyse statistique du logiciel rSpace qui montre que les données répétées pour le deuxième cycle se situent toutes dans la limite de tolérance de ±5% fixée. Sur la base des critères établis, l'échantillon A est un échantillon thermiquement stable. Pour l'échantillon B cependant, il y a clairement une différence dans les données sur les deux cycles de température, en particulier sur la section de la rampe de descente du deuxième cycle thermique où il y a une augmentation significative du Module complexeLe module complexe se compose de deux éléments, le module de stockage et le module de perte. Le module de stockage (ou module de Young) décrit la rigidité et le module de perte décrit le comportement d'amortissement (ou viscoélastique) de l'échantillon correspondant en utilisant la méthode de l'analyse mécanique dynamique (DMA). module complexe. En appliquant les mêmes statistiques de courbe, les données répétées pour l'échantillon B étaient en dehors de la limite de tolérance de ±5% fixée. Sur la base des critères établis, l'échantillon B est un échantillon thermiquement instable.
Conclusion
L'essai de deux échantillons de crème pour la peau a montré qu'il est possible de déterminer la Stabilité thermiqueUn matériau est thermiquement stable s'il ne se décompose pas sous l'influence de la température. Une façon de déterminer la stabilité thermique d'une substance est d'utiliser un ATG (analyseur thermogravimétrique). stabilité thermique d'un produit au moyen d'essais de cycles de température à une fréquence unique. Pour les échantillons testés, l'échantillon A est thermiquement stable et ne se dégrade pas pendant le transport et le stockage, tandis que l'échantillon B n'est pas thermiquement stable et est plus susceptible de se dégrader pendant le transport et le stockage en raison des températures extrêmes.
A noter...
qu'une géométrie à plaques parallèles ou une géométrie cylindrique peuvent également être utilisées pour cet essai - ces géométries étant préférables pour les dispersions et les émulsions dont la taille des particules est de large. Une géométrie de sablage doit être envisagée si le matériau est susceptible de présenter des effets de glissement de paroi.