
06.04.2021 by Dr. Natalie Rudolph, Dr. Stefan Schmölzer
Pomiar pojemności cieplnej właściwej do symulacji procesów SLS
Podjęto znaczne wysiłki w celu modelowania i symulacji procesu selektywnego spiekania laserowego, ponieważ informacje o polu temperatury w niższych warstwach są trudne do zmierzenia. Dowiedz się, jak Pojemność cieplna właściwa (cp)Pojemność cieplna jest wielkością fizyczną specyficzną dla materiału, określoną przez ilość ciepła dostarczonego do próbki, podzieloną przez wynikający z tego wzrost temperatury. Pojemność cieplna właściwa jest związana z jednostką masy próbki. pojemność cieplna właściwa może pomóc!
Podczas procesu SLS (Select ive Laser Sintering) wcześniej stopione warstwy znikają w złożu proszku otoczonym niespieczonym proszkiem. Dlatego informacje o polu temperatury w dolnych warstwach są trudne do zmierzenia. W związku z tym podjęto znaczne wysiłki w celu modelowania i symulacji procesu SLS. Dwie wielkości, które są niezbędne do tego celu, to pojemność cieplna właściwa (Pojemność cieplna właściwa (cp)Pojemność cieplna jest wielkością fizyczną specyficzną dla materiału, określoną przez ilość ciepła dostarczonego do próbki, podzieloną przez wynikający z tego wzrost temperatury. Pojemność cieplna właściwa jest związana z jednostką masy próbki.cp) i przewodność cieplna (k) w funkcji temperatury. Dodanie wypełniaczy nie tylko zmienia szybkość krystalizacji, ale także wymaga wyższej temperatury wytwarzania ze względu na zmianę Pojemność cieplna właściwa (cp)Pojemność cieplna jest wielkością fizyczną specyficzną dla materiału, określoną przez ilość ciepła dostarczonego do próbki, podzieloną przez wynikający z tego wzrost temperatury. Pojemność cieplna właściwa jest związana z jednostką masy próbki.cp i k.
Jak określić pojemność cieplną właściwą
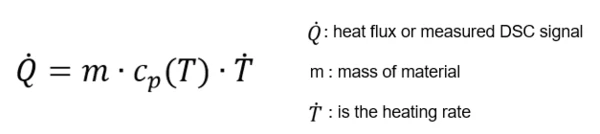
Aby określić pojemność cieplną właściwą w funkcji temperatury różnych materiałów, stosuje się różnicową kalorymetrię skaningową (DSC). Pojemność cieplną definiuje się jako ilość ciepła niezbędną do podniesienia temperatury 1 g substancji o 1°C przy stałym ciśnieniu p. Pojemność cieplną opisuje równanie przewodnictwa cieplnego. Jest ona opisana równaniem przewodzenia ciepła:
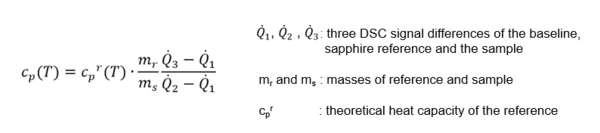
Zgodnie z normą DIN EN ISO 11357-4 (i ASTM E1269), próbka jest mierzona w odniesieniu do drugiej (referencyjnej) próbki o znanej pojemności cieplnej. Typową próbką referencyjną jest szafir, dlatego jeden eksperyment składa się z trzech różnych przebiegów w interesującym zakresie temperatur. Pierwszym z nich jest skanowanie z dwoma pustymi szalkami (linia bazowa), drugim skanowanie z jedną szalką zawierającą próbkę szafiru (odniesienie), a na koniec trzeci przebieg z rzeczywistą próbką (próbka) w tym samym typie szalki.
Cp jako funkcję temperatury próbki można obliczyć w następujący sposób:
Wykonywanie pomiarów cp na próbkach proszku polimerowego SLS
W tym przykładzie proszku polimerowego, a dokładniej PA12, pomiary przeprowadzono przy użyciu urządzenia NETZSCH DSC 204 F1 Phoenix® zgodnie z normą. Po początkowym etapie chłodzenia do -25°C, temperaturę zwiększono do 215°C z prędkością 10 K/min. Zmierzono dwie różne próbki i obliczono średnią. Wszystkie warunki pomiarowe zostały podsumowane w poniższej tabeli:
Tabela 1: Warunki pomiaru
| Patelnia Próbka | Concavus® al, przebita pokrywa |
| Masa próbki | 11.55 mg |
| Odniesienie do Calibra | Szafir |
| Odniesienie do szalki | Concavus® al, przebita pokrywa |
| Atmosfera | N2 |
| Natężenie przepływu gazu | 40 ml/min |
| Temperatura | -25 ... 215°C przy 10 K/min |
Analiza w oprogramowaniu NETZSCH Proteus® jest pokazana na rysunku 1. Pokazuje on "pozorną" pojemność cieplną właściwą, nałożoną na pik topnienia i zeszklenia.
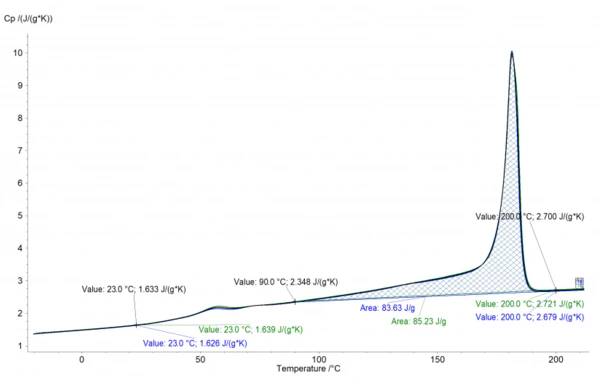
Dane Pojemność cieplna właściwa (cp)Pojemność cieplna jest wielkością fizyczną specyficzną dla materiału, określoną przez ilość ciepła dostarczonego do próbki, podzieloną przez wynikający z tego wzrost temperatury. Pojemność cieplna właściwa jest związana z jednostką masy próbki.cp można łatwo wywnioskować z tej krzywej. Jednak w zakresie temperatur między 90-190°C efekt rosnącego Pojemność cieplna właściwa (cp)Pojemność cieplna jest wielkością fizyczną specyficzną dla materiału, określoną przez ilość ciepła dostarczonego do próbki, podzieloną przez wynikający z tego wzrost temperatury. Pojemność cieplna właściwa jest związana z jednostką masy próbki.cp i EndotermicznyPrzemiana próbki lub reakcja jest endotermiczna, jeśli do konwersji potrzebne jest ciepło.endotermiczny efekt topnienia są sobie przeciwne. Dlatego wartości w zakresie topnienia są zazwyczaj interpolowane. W przypadku pokazanego tutaj PA12 interpolacja byłaby przeprowadzana między 90°C (2,348 J/gK) a 200°C (2,7 J/gK), które są wskazane na wykresie. Wartości te można następnie wyeksportować do późniejszego wykorzystania w symulacjach materiałowych i procesowych, np. dla temperatury złożonej i krzepnięcia w procesie SLS. Innym zastosowaniem danych jest obliczanie przewodności cieplnej na podstawie danych dotyczących dyfuzyjności cieplnej i gęstości.