Introduction
Fillers have long played an important role in the polymer manufacturing industry. First added to decrease prices of materials, they are now mainly used for their other advantages: Fillers can decrease shrinkage, increase stiffness and sometimes improve appearance. They are introduced with the objective either of creating new material properties not possessed by the matrix material, such as flame retardancy, or of enhancing existing properties as is the case with fibers.
When measuring how a filled material changes in length when being heated or cooled, an important property to consider is the thermal expansion coefficient, α, or Coefficient of Linear Thermal Expansion (CLTE/CTE)The coefficient of linear thermal expansion (CLTE) describes the length change of a material as a function of the temperature.CTE (coefficient of thermal expansion). Knowledge about a material’s behavior in this regard is needed for determining values that are crucial for design, such as shrinkage, in order to ensure compatibility between joining partners in a final product.
However, the Coefficient of Linear Thermal Expansion (CLTE/CTE)The coefficient of linear thermal expansion (CLTE) describes the length change of a material as a function of the temperature.CTE is sensitive to the orientation of the filler in the molded part. This orientation depends strongly on the flow field, which describes how the material fills the mold. Therefore, different values for the Coefficient of Linear Thermal Expansion (CLTE/CTE)The coefficient of linear thermal expansion (CLTE) describes the length change of a material as a function of the temperature.CTE are to be expected in the molded part. This article aims to investigate this assumption. For this study, a lowviscosity PEEK resin with 40 vol% short carbon fibers was injection-molded into a plate mold of 80 x 80 mm and 2 mm thickness at Neue Materialien Bayreuth. A film gate was used to obtain a more uniform flow front and reduce fiber breakage, which could occur through a thinner gate. The material was dried at 150°C for 3 h before injection-molding it with a melt temperature of 410°C into a mold at 175°C.
According to the data sheet, the Melting Temperatures and EnthalpiesThe enthalpy of fusion of a substance, also known as latent heat, is a measure of the energy input, typically heat, which is necessary to convert a substance from solid to liquid state. The melting point of a substance is the temperature at which it changes state from solid (crystalline) to liquid (isotropic melt).melting point is at 343°C and the Glass Transition TemperatureThe glass transition is one of the most important properties of amorphous and semi-crystalline materials, e.g., inorganic glasses, amorphous metals, polymers, pharmaceuticals and food ingredients, etc., and describes the temperature region where the mechanical properties of the materials change from hard and brittle to more soft, deformable or rubbery.glass transition, Tg, at 143°C. The melt viscosity at 400°C is as low as 300 Pas. The thermal expansion coefficient, α, is given in table 2. Typically, the measurements from the data sheet are performed on a dogbone test specimen which are typically molded with a film gate as well. It has a thickness of 4 mm and a total length of 185 mm. Because the filler orientation depends strongly on the flow field, it is likely that the resulting filler orientation will be different in the mold from Neue Materialien Bayreuth than in the mold used to determine the properties on the data sheet. As already mentioned, the thermal expansion coefficient is sensitive to the filler orientation, different values for the Coefficient of Linear Thermal Expansion (CLTE/CTE)The coefficient of linear thermal expansion (CLTE) describes the length change of a material as a function of the temperature.CTE are to be expected in the plate and further in different regions of the plate.
How Does the Molten Material Flow into the Mold?
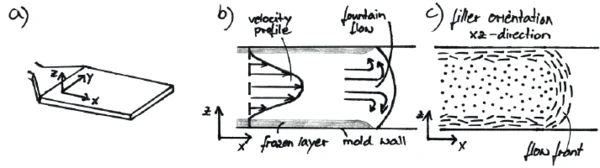
Figure 2 shows a schematic of the sample plate (a); further, is shows the velocity profile across the thickness of the part as well as the fountain flow at the melt front (b) and the resulting fiber orientation (c). Due to the velocity gradient, different forces and moments act on the fibers and lead to a characteristic fiber orientation within the part. In the center of the part, the fibers are oriented perpendicular to the flow direction due to extensional and transverse flow. Due to the high shear rates at the wall or frozen layer, the fibers are aligned parallel to the flow. The thickness of this highly oriented layer depends on the frozen layer thickness and the velocity profile.
How Were the Samples for the Experiment Preparedand Measured?
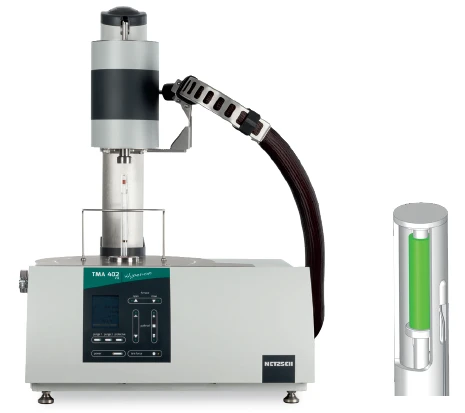
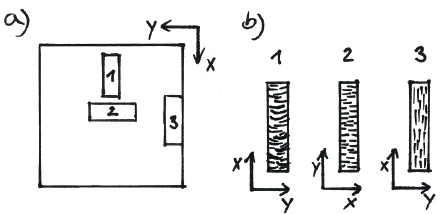
For the TMA measurements at NETZSCH Analyzing & Testing, samples of 25 x 5 mm were cut from different regions of the plate according to Figure 3(a) to study the effect of fiber orientation on the thermal expansion coefficient. The expected dominant fiber orientation is depicted in the samples shown in 3(b). The samples were measured with the TMA 402 F3 Hyperion® Polymer Edition (figure 1). After an initial cooling step, the temperature was increased from -70 to 300°C at a heating rate of 5 K/min. The thermal expansion coefficient was calculated using the mean Coefficient of Linear Thermal Expansion (CLTE/CTE)The coefficient of linear thermal expansion (CLTE) describes the length change of a material as a function of the temperature.CTE analysis (m. CTE), which computes the slope between two data points. All measurement conditions are summarized in table 1.
Table 1: Test conditions
| Sample holder | Expansion, made of SiO2 |
| Sample load | 50 mN |
| Atmosphere | N2 |
| Gas flow rate | 50 ml/min |
| Temperature range | -70 ... 300°C at a heating rate of 5 K/min |
How Does the Thermal Expansion Correlate to the Flow Field?
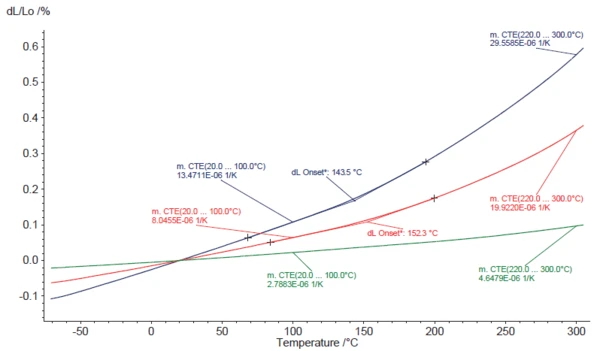
The results are shown in Figure 4. The blue line is sample 2, the red line sample 1 and the green line sample 3. As expected, the CTE above the Tg is higher than below the Tg; for these samples it is about double. It can be seen that the CTEs of sample 3 are the lowest and sample 2 has the highest values. Sample 1 is in between. The same trend among samples is observable in the Tg. Sample 2 – which is more dominated by the matrix behavior compared to the other samples – has the same Tg of 143°C as listed in the datasheet (measured with a DSC). Sample 1, for which the effect of the fiber in the CTE is greater, has a higher Tg of 152°C; this indicates the higher stiffness introduced by the fibers. This can be detected in a TMA, because it measures a mechanical response. Sample 3 is strongly dominated by the fibers and therefore, the Tg is hardly visible and was not analyzed.
Comparing the measurements on the three samples to the values in the datasheet, it can be seen that the differing sample thicknesses and overall geometries indeed result in different CTE values. The CTE in the flow direction is in all samples higher than in the datasheet. This means that it is very important to obtain CTE values on specimens of similar shape and geometry to those of the final product. Otherwise, parameters that are essential for design such as shrinkage or compatibility between joining partners, will get over- or under-predicted.
From the CTE measurements as well as the theory of fiber orientation in the flow field, the dominant fiber orientation in the samples can be deduced; see figure 3(b). It can be seen that due to the thinness of the samples, the effect of the frozen layer seems to be dominant in samples 2 and 3. The majority of the fibers are oriented in the flow direction x. Therefore, sample 3 yields the lowest CTE (measurement in the flow and in the fiber direction) and sample 2 the highest values (measurement perpendicular to the flow and fiber direction). Sample 1 is in between the two, because the fountain flow effect is still the largest in this area due to its proximity to the film gate and the fact that that fiber orientation follows the circular flow at the melt front.
A summary of the resulting Tgs is presented in table 2.
Table 2: Summary of the resulting Tgs
| Sample 1 (red) | Sample 2 (blue) | Sample 3 (green) | Manufacturer's datasheet | |
|---|---|---|---|---|
| Tg [°C] | 152 | 143 | - | 143 |
Summary
The study showed the importance of analyzing the coefficient of thermal expansion of filled materials based on the filler orientation, which is influenced by the flow field during injection molding.
Acknowledgement
We would like to thank Neue Materialien Bayreuth GmbH for providing the samples.
About Neue Materialien Bayreuth GmbH
Neue Materialien Bayreuth GmbH is a non-academic research company developing various novel materials for lightweight constructions, from polymers and fiberreinforced composites to metals, including also the processing. They provide application-oriented solutions by optimizing available materials and production processes (https://www.nmbgmbh.de/en/).