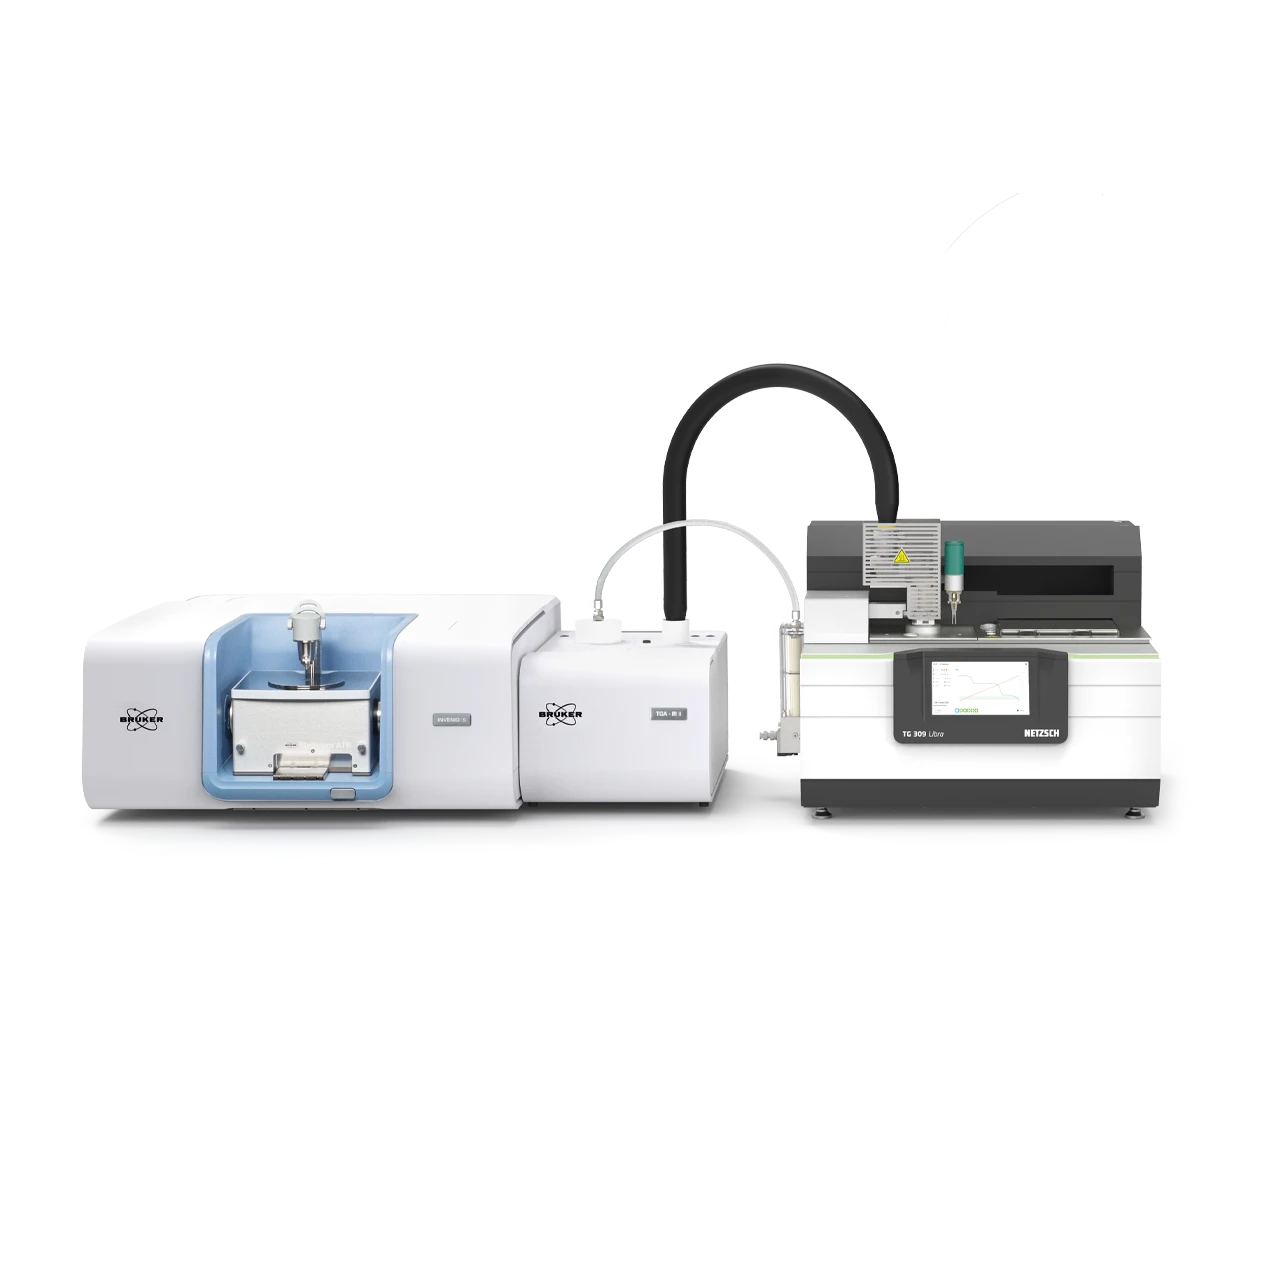
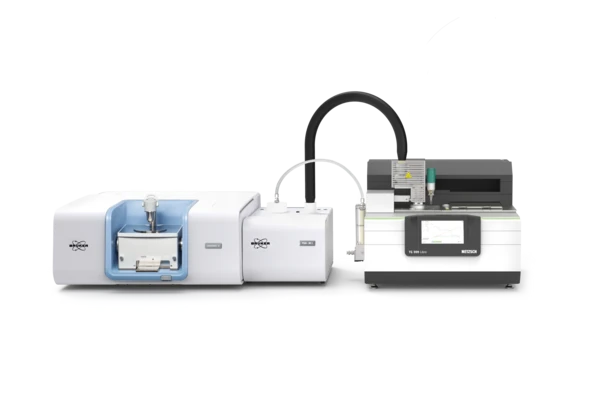
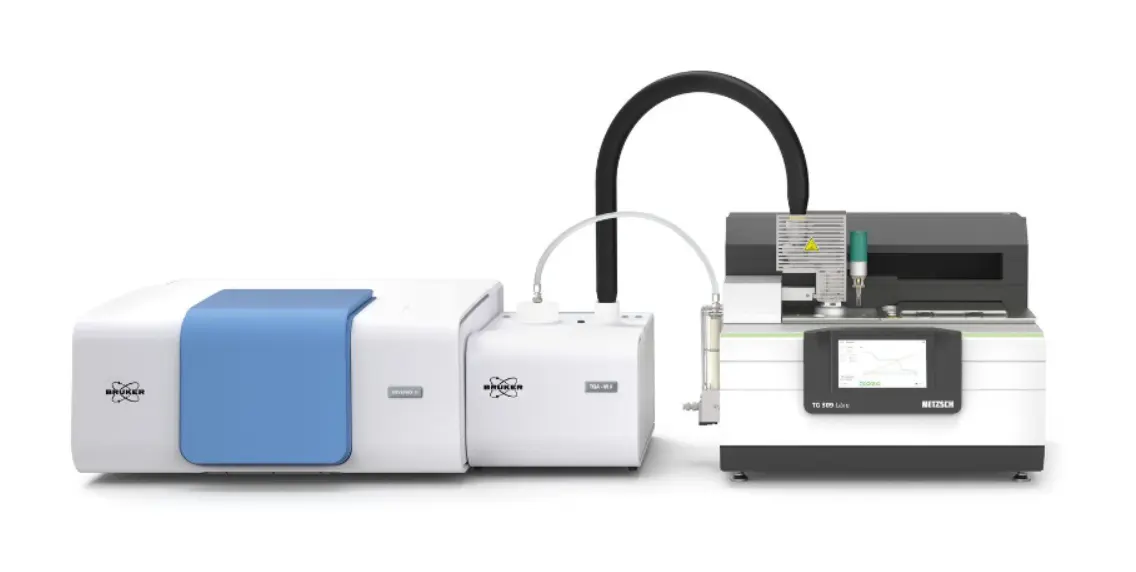
TG 309 Libra® Coupled to Bruker's INVENIO via Transfer Line
The Perfect TGA-FT-IR Coupling Solution
Highlights
Thermal Analysis Plus FT-IR - More Than Just the Sum of Its Parts
The INVENIO TG 309 Libra® with transfer line coupling combines high-performance thermogravimetric analysis (TGA) with advanced gas phase detection via FT-IR spectroscopy. This powerful setup enables a deeper understanding of Decomposition reactionA decomposition reaction is a thermally induced reaction of a chemical compound forming solid and/or gaseous products. decomposition, OxidationOxidation can describe different processes in the context of thermal analysis.oxidation, and other thermal processes by correlating mass changes with the identification of gases evolved upon heating.
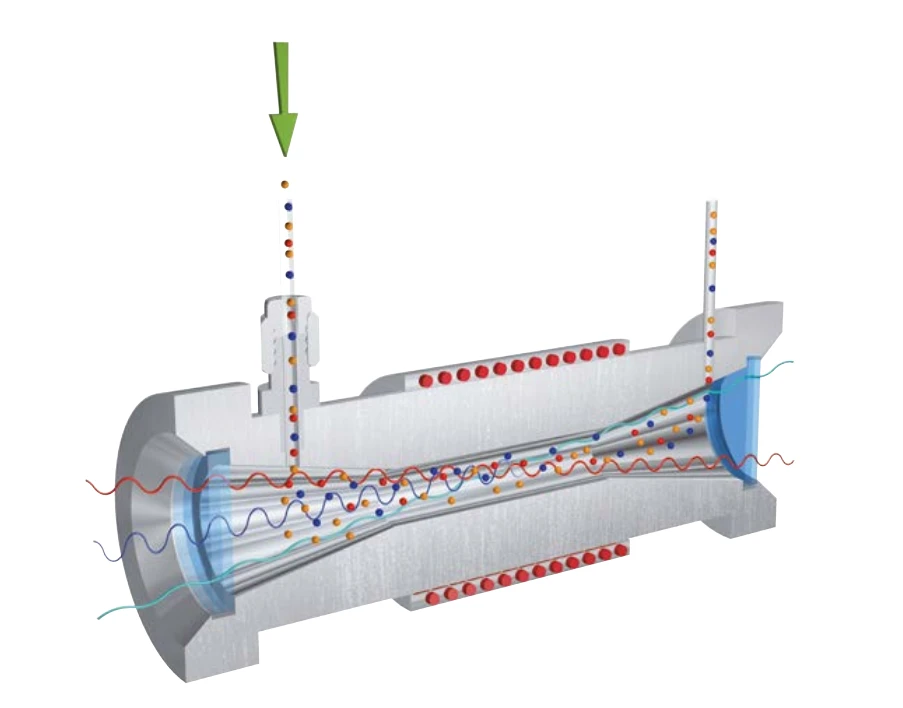
Using a heated transfer line, the system offers maximum flexibility in laboratory layout, allowing the FT-IR spectrometer to be positioned independently from the TGA unit. All gas path components – from the furnace outlet to the FT-IR gas cell – are temperature-controlled, ensuring accurate and condensation-free gas transport, even for reactive or condensable species.
Coupled with the Bruker INVENIO FT-IR platform, the system delivers high spectral resolution and sensitivity across a broad range of applications, including polymers, chemicals, pharmaceuticals, and inorganic materials. The seamless integration of NETZSCH Proteus® and Bruker OPUS software ensures synchronized data acquisition, allowing users to directly correlate weight loss events with specific gas species and reaction mechanisms.
This modular solution is upgradeable from any existing TG 309 Libra® Select orSupreme model, protecting your investment while opening new possibilities in thermal analysis and hyphenated techniques.
Method
Fourier Transform Infrared (FT-IR) Spectrometers Coupled to Thermal Analysis
Thermal analysis provides ideal tools for the characterization of a variety of organic and inorganic solids and liquids. Thermodynamic transitions, Thermal StabilityA material is thermally stable if it does not decompose under the influence of temperature. One way to determine the thermal stability of a substance is to use a TGA (thermogravimetric analyzer). thermal stability, Decomposition reactionA decomposition reaction is a thermally induced reaction of a chemical compound forming solid and/or gaseous products. decomposition, and chemical reactions can be detected and quantified with high accuracy over a broad temperature range.
In some cases, however, information about the type of evolved gases is needed to gain a clearer understanding of the chemistry behind the processes. Coupling thermal analysis with powerful infrared spectroscopy for gas analysis bridges this gap. It allows for a deeper insight into the material’s behavior and provides a spectral fingerprint of the gases evolved from the sample when heated..
The Proteus® software for thermal analysis and the OPUS software for FT-IR measurements are seamlessly integrated to enable efficient Thermal Analysis-to-FT-IR coupling. The temperature and time correlations of all experimental data are carefully preserved throughout the process.
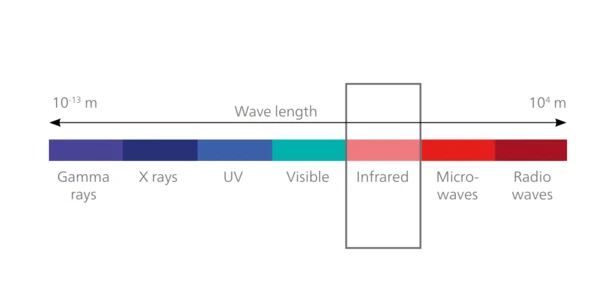
Infrared spectroscopy
Infrared spectroscopy is a classical technique based on the absorption of infrared radiation by molecular bond vibrations. This absorption occurs when bonds vibrate in specific ways. However, only those vibrations that cause a change in dipole moment can interact with IR light. This is why most substances produce a characteristic spectrum, while homonuclear molecules — such as O₂ and N₂ — or noble gases do not show fundamental IR absorption bands, due to the absence of dipole moment changes during VibrationA mechanic process of oscillation is called vibration. Vibration is a mechanical phenomenon whereby oscillations occur about an equilibrium point. In many cases, vibration is undesirable, wasting energy and creating unwanted sound. For example, the vibrational motions of engines, electric motors, or any mechanical device in operation are typically unwanted. Such vibrations could be caused by imbalances in the rotating parts, uneven friction, or the meshing of gear teeth. Careful designs usually minimize unwanted vibrations.vibration.
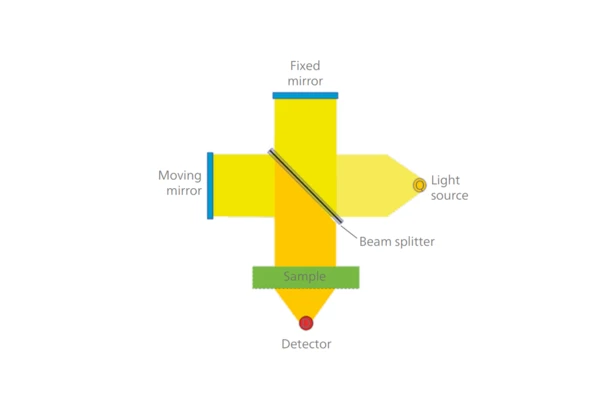
Working principle of a FT-IR spectrometer
An infrared light beam, depicted in the diagram as coming from the source on the right, is split into two paths by a beam splitter. One path is directed toward a fixed mirror and reflected, while the other is reflected by a moving mirror.
After reflection, the two beams are recombined and interfere with each other. The resulting interference pattern depends on the distance between the two mirrors — which changes as the moving mirror shifts position — and the frequencies present in the beam.
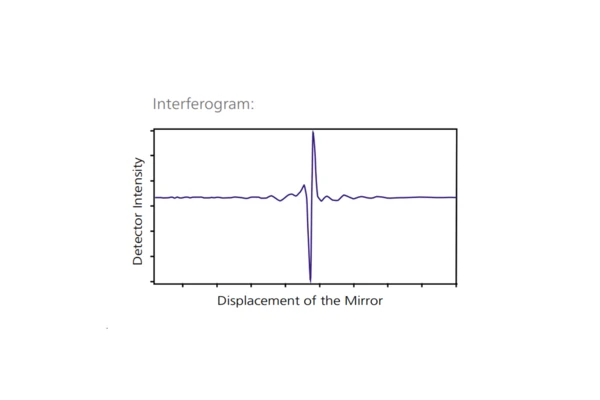
This process generates an interferogram, a signal typically characterized by a central burst and flat wings. The central burst occurs when both mirrors are equidistant from the beam splitter, allowing all frequencies to interfere constructively.
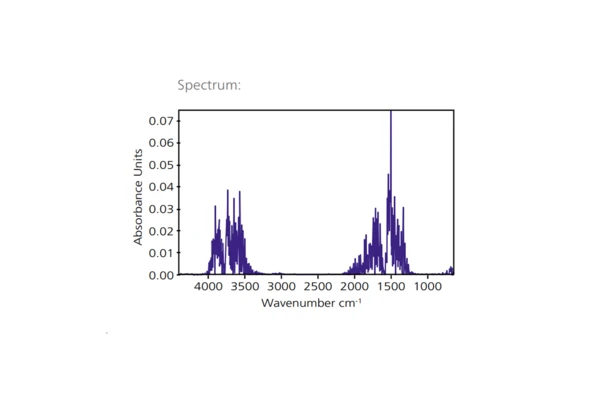
Finally, the interferogram is mathematically transformed into a spectrum using a Fourier Transform, revealing the sample’s infrared absorption characteristics.

Over 30 Years of Successful Cooperation
For over 30 years, NETZSCH and Bruker have collaborated to provide integrated solutions for thermal analysis and gas analysis. This longstanding partnership combines NETZSCH's expertise in thermal analysis with Bruker's leadership in FT-IR technology, offering customers reliable, high-quality systems tailored to their needs. Together, we deliver innovative, user-friendly solutions from a single source, ensuring seamless operation and exceptional support.
Advantages of our Cooperation at a Glance:
- Seamless integration: Optimized coupling of NETZSCH thermal analyzers with Bruker FT-IR spectrometers for reliable and efficient evolved gas analysis.
- Proven expertise: Decades of joint experience ensure high-quality, innovative solutions tailored to customer needs.
- Single-source convenience: Fully compatible systems with comprehensive support from both partners.
- Enhanced performance: Precise coordination of instruments delivers accurate and reproducible results.
- Continuous innovation: Collaboration fosters the development of cutting-edge technologies and features for advanced analysis.
- Effortless Compatibility with Bruker's OPUS Software: At NETZSCH, we offer seamless compatibility with Bruker’s OPUS software, allowing for a smooth workflow between both systems. This ensures an integrated and efficient experience, making the most out of both instruments.
Specifications
Gas cell volume and length
Temperature of transfer line
Detector
Wave number range:
FT-IR: 8000 cm-1 to 340 cm-1
Coupling: 4400 cm-1 to 600 cm-1
Resolution:
better than 0.4 cm-1
Furnace adaptor:
max. 400°C
Transfer line material:
Stainless steel (exchangeable)
Window material gas cell:
KBr
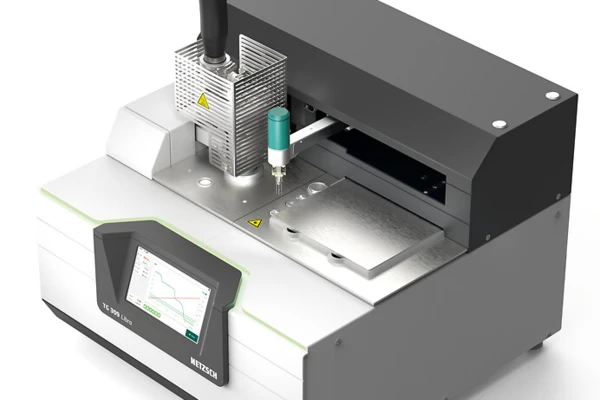
Acessories
The automatic sample changer (ASC) similarly handles routine measurements in quality control as well as requirements for research and development. It works around the clock to free your time for other challenges and allows you to make optimal use of the coupling even during the weekend. Of course, each sample can be assigned a different measurement and evaluation program. Easy-to-understand input fields lead you through the programming of a series of measurements. Unplanned analyses can also be inserted into a pre-programmed series of measurements already in progress.
Find out even more about the Transfer Line Coupling


Proven Excellence in Service
At NETZSCH Analyzing & Testing, we offer a comprehensive range of services globally to ensure the optimal performance and longevity of your thermoanalytical equipment. With a track record of proven excellence, our services are designed to maximize the effectiveness of your devices, extend their lifespan, and minimize downtime.
Unlock the full potential of your equipment with our tailored solutions, backed by years of industry expertise and innovation.
Software
Bruker OPUS and NETZSCH Proteus® – Unrivaled Combination for Maximum Ease of Use


The alliance between the NETZSCH Proteus® software and the OPUS FT-IR software is based on synchronized data exchange, enabling coordinated operation of the coupled systems. Measurements are started via the NETZSCH Proteus® software, which simultaneously triggers data acquisition in OPUS. Users only need to input the command for measurement start and data acquisition once; both OPUS and Proteus® will then operate with the predefined parameters. Online data collection is fully synchronized, ensuring precise time and temperature correlation between all signals from the two coupled instruments during evaluation. The two software packages can be operated from a single computer, giving users access to the full range of data evaluation and results display options in either environment at any time.
Find out even more about the software:
- Full software integration – online data exchange between the two instrument software packages during the running experiment
- Seamless instrument control, measurement definition for TGA and FT-IR entirely controlled by Proteus® software
- Segmental activation or deactivation of the FT-IR coupling with one mouse click
- Automatic saving of data sets for both measurements (TGA and FT-IR) with identical file names (but different extensions) in the same directories
- Measurements with automatic sample changer allow for individual FT-IR measurement parameter for each position
- Conjoint presentation of the Gram-Schmidt plot plus up to 30 pre-selected traces together with thermal analysis curves in Proteus® software during the experiment
- Online evaluation (SNAP SHOT) of TGA/STA/DSC measurements already including FT-IR data during the measurement
- Trace calculations with evaluation of characteristic temperatures and peak areas together with TGA and DSC curves
- Combined analysis graphics of thermal analysis and FT-IR signals
- Multi-component search in OPUS
- Identification by various gas phase librarys, e.g. TGA-FT-IR library of polymers by NETZSCH
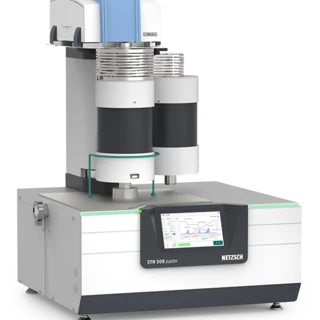
Related Devices
Consultancy & Sales
Do you have further questions about the instrument or the method and would like to speak to a sales representative?
Service & Support
Do you already have an instrument and need technical support or spare parts?