Introduction
In the field of thermal analysis up to now, researchers had to compare own data with printed collections of measurement results such as “Atlas of Thermoanalytical Curves” [1] and others [2, 3, 4].
Recently, the first software-based database in thermal analysis, Identify, has been introduced [5]. This database allows for the first time to compare measured thermoanalytical data with library data stored in the database using a software. As a result, the user obtains a list of similarity values, the figure of merit for this comparison, which is given in percent.
In the present work, Identify is used in different manners. Various polyamides are investigated employing differential scanning calorimetry (DSC). Using the information about polyamides stored in the Identify database, it will be demonstrated that even small differences in the thermal behavior of the polyamide types are sufficient to significantly distinguish between them. By means of evaluated values such as the Glass Transition TemperatureThe glass transition is one of the most important properties of amorphous and semi-crystalline materials, e.g., inorganic glasses, amorphous metals, polymers, pharmaceuticals and food ingredients, etc., and describes the temperature region where the mechanical properties of the materials change from hard and brittle to more soft, deformable or rubbery.glass transition temperature, Specific Heat Capacity (cp)Heat capacity is a material-specific physical quantity, determined by the amount of heat supplied to specimen, divided by the resulting temperature increase. The specific heat capacity is related to a unit mass of the specimen.specific heat capacity, Melting Temperatures and EnthalpiesThe enthalpy of fusion of a substance, also known as latent heat, is a measure of the energy input, typically heat, which is necessary to convert a substance from solid to liquid state. The melting point of a substance is the temperature at which it changes state from solid (crystalline) to liquid (isotropic melt).melting temperature or melting enthalpy, a series of recycled polyamide samples was investigated and then classified by comparison with results of a virgin material stored in the database. Thus, the use of Identify as a tool for classification of recycled polyamides will be demonstrated.
Materials and Methods
The recycled polyamide samples were measured as received. They were designated Pentamid B GV30 batch 001 to 009. The samples used as a reference were PA6 GF30 (durethan, natur), PA6.6 GF30 (ultramid, natur), PA6.10, PA6.12 (grilamid).
The melting behavior of the polyamide samples was studied using the DSC 214 Polyma. Aluminum pans (NETZSCH Concavus®) with pierced lids were used to heat, to cool, and to reheat the samples at a rate of 20 K/min. The two heating segments were each run to 280°C. The second heating for each polyamide sample was used to evaluate the enthalpy of melting. All samples were prepared with masses of 4.955 (± 0.05) mg.
The thermogravimetric measurements were carried out using the thermo-microbalance TG 209 F3 Tarsus®. The samples with masses of 11.45 (± 0.35) mg were transferred into aluminum oxide crucibles and heated at a rate of 20 K/min to 800°C in nitrogen. For the consecutive heating to 1000°C the atmosphere was switched to synthetic air (nitrogen:oxygen = 90:10) at 800°C. The total gas flow rate of the inert and reactive gas was 40 ml/min.
Results and Discussion
In order to prove the capability of the Identify database in terms of identification of materials, virgin polymers – here taken as reference materials – were tested. The granules were prepared in aluminum pans as described above transferred into the DSC apparatus and heated in a nitrogen atmosphere to temperatures above melting. The second heating was evaluated and the obtained results were compared to results stored in the Identify database.
Figure 1 compares the second heating run for each of the four different polyamides, PA6 GF30 (1), PA6.10 (2), PA6.12 (3) and PA6.6 GF30 (4). Whereas the Melting Temperatures and EnthalpiesThe enthalpy of fusion of a substance, also known as latent heat, is a measure of the energy input, typically heat, which is necessary to convert a substance from solid to liquid state. The melting point of a substance is the temperature at which it changes state from solid (crystalline) to liquid (isotropic melt).melting temperature of PA6.6 GF30 was detected at a significantly higher temperature, the main endothermal melting effect for PA6 GF30, PA6.10 and PA6.12 was in the same temperature range. However, the database is able to distinguish and identify these samples. Tables 1a to 1d show the similarity values delivered by the database, when comparing the measured data (Figure 1) to already existing data of the library. If, for instance, the results for PA6 GF30 (curve 1 in Figure 1) are requested for comparison with database data, the similarity with polyamide 6 data stored in the database is 97%. The results stored in the database, serving for this comparison, are of course not taken from the identical measurement, but from a different measurement of a similar, but not identical sample. This is why the similarity is not exactly 100%, but therefore the proof to be able to also identify unknown samples via this procedure is much more reliable. Other polyamides, melting in the same temperature range such as PA6.10 and PA6.12, were found to have significantly lower similarities, namely 87% and 84%, respectively. The same applies if PA6.10 or PA6.12 is the sample to be identified and compared to library data. The results are summarized in tables 1a, 1b and 1c. Since polyamide 6.6 melts at an about 40 K higher temperature compared to the above-mentioned polyamides, the further data in the library are no polyamides but ETFE, PET, PPS and FEP. This procedure confirms, along with recently published data [6] [7], the capability of the Identify database to distinguish between samples with a similar thermal behavior.
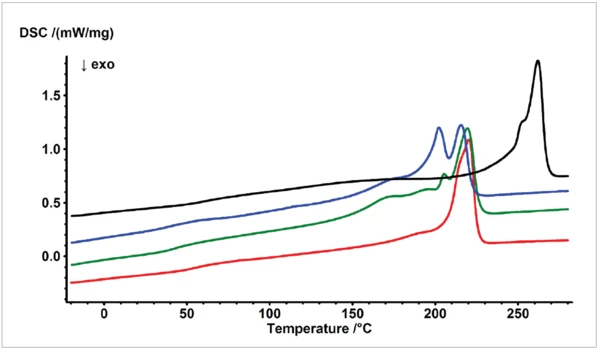
Table 1a: Results of the database search for reference sample PA6 (similarity in %)
to be identified | PA6 | PA6.12 | PA6.10 | PVA | PBT |
|---|---|---|---|---|---|
| PA6 | 97 | 87 | 85 | 76 | 70 |
Table 1b: Results of the database search for reference sample PA6.10 (similarity in %)
to be identified | PA6.10 | PA6.12 | PA6 | PBT | PVA |
|---|---|---|---|---|---|
| PA6.10 | 98 | 85 | 86 | 81 | 56 |
Table 1c: Results of the database search for reference sample PA6.12 (similarity in %)
to be identified | PA6.12 | PA6.10 | PA6 | PBT | PVF |
|---|---|---|---|---|---|
| PA6.12 | 96 | 87 | 77 | 64 | 46 |
Table 1d: Results of the database search for reference sample PA6.6 (similarity in %)
to be identified | PA6.6 | ETFE | PET | PPS | FEP |
|---|---|---|---|---|---|
| PA6.6 | 96 | 87 | 60 | 51 | 47 |
The similarity values are summarized in table 3. Figure 2 depicts the visual comparison of these results together with the PA6 GF30 sample used as a reference (dashed line). The curves are displayed according to the similarity values given in table 3 with decreasing similarity values from bottom to top.
As a consecutive step, a series of recycled polyamide 6 samples was studied. All samples were of the same origin, but taken from different batches, namely having the same composition PA6 GF30. In order to proof the composition and to get a clear picture about the margin of deviation regarding the samples composition as well as about the repeatability of sampling, thermogravimetric measurements were carried out. Tab. 2 summarizes the samples’ compositions with respect to the content of volatiles, the polymer content, the Carbon BlackTemperature and atmosphere (purge gas) affect the mass change results. By changing the atmosphere from, e.g., nitrogen to air during the TGA measurement, separation and quantification of additives, e.g., carbon black, and the bulk polymer can become possible.carbon black content and the residual mass. As long as the samples do not contain any other chemically inert ingredients, the latter should be equivalent to the amount of added glass fibers. Samples PA6.10 and PA6.12 do not show any residuals inside the crucible after the measurements. All other samples show a white to light yellow molten residual.
Table 2: Comparison of the thermogravimetric results (mass loss in %) for all recycled polyamides and reference materials tested
PA6 samples / reference samples | Volatiles 25 to 250°C | Polymer 250 to 800°C | Carbon black 800 to 1000°C | Residual Mass |
|---|---|---|---|---|
| 001 | 1.16 | 66.66 | 1.49 | 30.69 |
| 002 | 1.10 | 67.01 | 1.45 | 30.45 |
| 003 | 1.25 | 66.77 | 1.74 | 30.24 |
| 004 | 1.11 | 67.05 | 1.44 | 30.40 |
| 005 | 1.23 | 68.41 | 1.04 | 29.31 |
| 006 | 1.15 | 67.54 | 1.45 | 29.86 |
| 007 | 1.14 | 67.72* | 1.23 | 29.90 |
| 008 | 1.12 | 67.87 | 1.70 | 29.31 |
| 009 | 1.19 | 66.74 | 1.66 | 30.41 |
| PA6 GF30 | 0.71 | 69.73 | 0.29 | 29.27 |
| PA6.10 | 0.09 | 98.66 | 0.10 | 1.15 |
| PA6.12 | 0.45 | 98.73 | 0.25 | 0.60 |
| PA6.6 GF30 | 0.41 | 68.02 | 1.10 | 30.48 |
* Within the temperature range of 250 to 800°C, this sample shows an additional mass-loss step of 1.54% which is most probably due to the release of carbon dioxide originating from the Decomposition reactionA decomposition reaction is a thermally induced reaction of a chemical compound forming solid and/or gaseous products. decomposition of chalk. This would refer to a chalk content of 3.5%.
According to the detected glass fiber contents of 30.0% (±0.7), the TGA results could confirm the expected amount within an uncertainty of 2.5%. The thermal behavior of all batches of polymaide 6 samples (001 to 009) was then studied using differential scanning calorimetry (DSC). The second heating run each was compared to the database and also to the PA6 GF30 samples.
The similarity values are summarized in table 3. Figure 2 depicts the visual comparison of these results together with the PA6 GF30 sample used as a reference (dashed line). The curves are displayed according to the similarity values given in table 3 with decreasing similarity values from bottom to top.
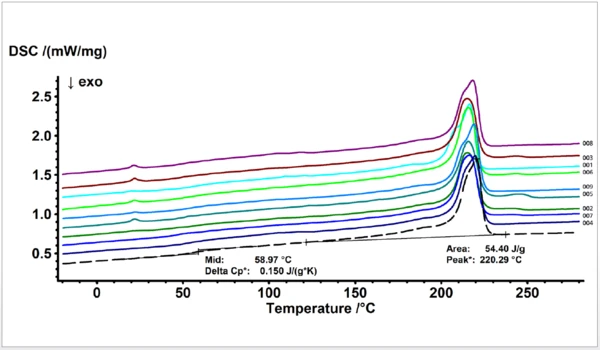
Table 3: Results of the database search for nine different recycled PA6 GF30 samples compared to a virgin PA6 GF30
Samples | Similarity in % |
|---|---|
| PA6 GF 30 | 100 |
| 008 | 98 |
| 003 | 87 |
| 001 | 84 |
| 006 | 81 |
| 009 | 77 |
| 005 | 76 |
| 002 | 75 |
| 007 | 74 |
| 004 | 63 |
Besides variation of the peak temperature, the melting enthalpy, the change in Specific Heat Capacity (cp)Heat capacity is a material-specific physical quantity, determined by the amount of heat supplied to specimen, divided by the resulting temperature increase. The specific heat capacity is related to a unit mass of the specimen.specific heat capacity and the Glass Transition TemperatureThe glass transition is one of the most important properties of amorphous and semi-crystalline materials, e.g., inorganic glasses, amorphous metals, polymers, pharmaceuticals and food ingredients, etc., and describes the temperature region where the mechanical properties of the materials change from hard and brittle to more soft, deformable or rubbery.glass transition temperature, it is obvious that the recycled materials also show additional effects which were not expected and not detectable for the virgin sample. Additional EndothermicA sample transition or a reaction is endothermic if heat is needed for the conversion.endothermic effects were detected for some samples in the temperature range around 22, 105 and 245°C. They are most probably due to impurities or caused by foreign substances, mainly additives or other polymers. Those additional - unexpected – effects of course reduce the similarity values since they are not typical for the virgin materials and therefore not part of the data stored in the library database. This – on the other hand – means the database comparison takes into account if expected effects are missing or if additional effects are detected which are not stored in the database for this kind of material.
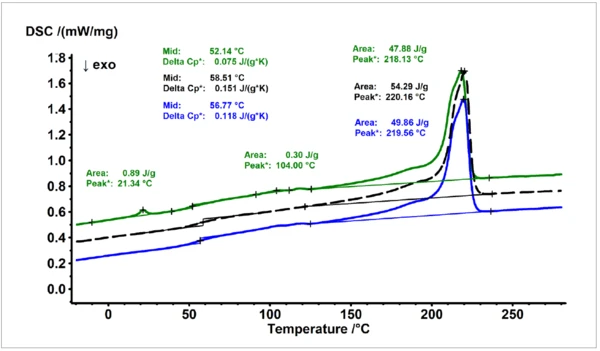
A comparison of the results obtained for the material serving as a reference (PA6 GF30, dashed black line, middle) with the most similar sample (blue) and the most different sample (green) according to the similarity results obtained from the database is shown in figure 3. The sample showing the weakest similarity does not only show additional EndothermicA sample transition or a reaction is endothermic if heat is needed for the conversion.endothermic effects at around 22 and 105°C, respectively, but also the evaluated values for the Melting Temperatures and EnthalpiesThe enthalpy of fusion of a substance, also known as latent heat, is a measure of the energy input, typically heat, which is necessary to convert a substance from solid to liquid state. The melting point of a substance is the temperature at which it changes state from solid (crystalline) to liquid (isotropic melt).melting temperature and the Glass Transition TemperatureThe glass transition is one of the most important properties of amorphous and semi-crystalline materials, e.g., inorganic glasses, amorphous metals, polymers, pharmaceuticals and food ingredients, etc., and describes the temperature region where the mechanical properties of the materials change from hard and brittle to more soft, deformable or rubbery.glass transition temperature are more shifted to lower values compared to the reference material than for the sample showing the most similar thermal behavior.
Conclusion
The recently introduced Identify database is the first thermoanalytical software offering a software-based comparison of measured DSC data with DSC measurement or literature values stored in the library.
A series of recycled polyamide samples were measured using the differential scanning calorimeter (DSC 214 Polyma). The evaluated values for the Glass Transition TemperatureThe glass transition is one of the most important properties of amorphous and semi-crystalline materials, e.g., inorganic glasses, amorphous metals, polymers, pharmaceuticals and food ingredients, etc., and describes the temperature region where the mechanical properties of the materials change from hard and brittle to more soft, deformable or rubbery.glass transition and melting were used as identification criteria. The Identfiy database offers the capability to not only distinguish between different types of polyamides such as PA6, PA6.6, PA6.10 and PA6.12 but it furthermore allows to detect and quantify difference in temperature or enthalpy for the above-mentioned caloric effects. Depending on the desired quality or processing demands, the similarity values can serve for classification of the material and might be used as a quality control tool.