Introduction
Epoxy resins are commonly used for coating, lamination and electronic materials. Their field of application extends to adhesive applications, especially when durability and strength are needed.
Many epoxy adhesives consist of two components, the epoxy resin and a hardener. As soon as the two compounds are mixed, Curing (Crosslinking Reactions)Literally translated, the term “crosslinking“ means “cross networking”. In the chemical context, it is used for reactions in which molecules are linked together by introducing covalent bonds and forming three-dimensional networks.curing begins: bonds are created between the epoxy resin and the hardener, forming a structural network. In practice, the start of the reaction and its duration are of interest. In this work, the changes in rheological properties of a two-part epoxy glue during Curing (Crosslinking Reactions)Literally translated, the term “crosslinking“ means “cross networking”. In the chemical context, it is used for reactions in which molecules are linked together by introducing covalent bonds and forming three-dimensional networks.curing are investigated by means of rotational rheometry. Furthermore, the measurements are used to determine the reaction kinetics. Finally, knowledge of the kinetic parameters of the Curing (Crosslinking Reactions)Literally translated, the term “crosslinking“ means “cross networking”. In the chemical context, it is used for reactions in which molecules are linked together by introducing covalent bonds and forming three-dimensional networks.curing allows for simulation of the reaction for user-specified temperature and time conditions.
Measurement Conditions
Oscillation measurements were carried out on the twopart epoxy glue using the NETZSCH Kinexus rotational rheometer.
After mixing the two components of the two-part epoxy glue at room temperature, the mixture was put on the lower plate of the Kinexus. The test time was set to 0 at start up mixing of both components, even though at this moment, the components were not yet loaded in the rheometer.
Disposable plates with a diameter of 8 mm were used for the measurement. This small diameter was selected in order to keep the final stiffness of the cured sample sufficiently low compared to the stiffness of the rheometer. A 1-mm measurement gap was used throughout the measurement.
Presented in table 1 are the conditions used for the oscillation measurement during Curing (Crosslinking Reactions)Literally translated, the term “crosslinking“ means “cross networking”. In the chemical context, it is used for reactions in which molecules are linked together by introducing covalent bonds and forming three-dimensional networks.curing with the Kinexus rotational rheometer.
Table 1: Conditions of the Curing Measurement
| Device | Kinexus ultra+ |
| Geometry | Disposable parallel plates, 8 mm diameter (PP8) |
| Measurement gap | 1 mm |
| Temperature program | 25°C ... 140°C at 2 K/min IsothermalTests at controlled and constant temperature are called isothermal.Isothermal 140°C for 5 min 140°C ... 25°C at 2 K/min |
| Frequency | 1 Hz |
Results and Discussion
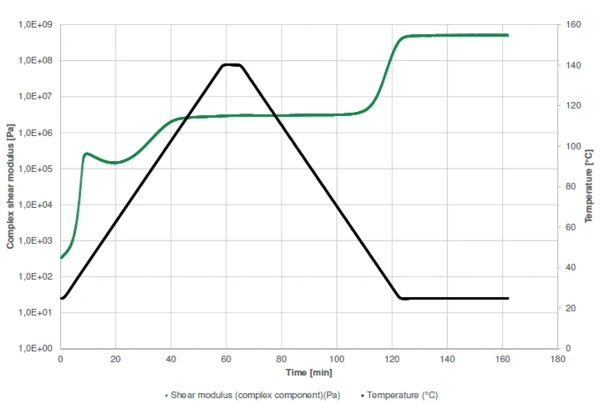
Figure 1 displays the measurement curve of the Complex Shear Modulus (G*)Shear modulus is a measurement of the stiffness of a material. complex shear modulus. In general, if no process occurs (such as a chemical reaction), heating of a sample will lead to its softening, i.e., to a decrease in stiffness (modulus). In this example, however, heating has two effects: In addition to a decrease in modulus, heating accelerates Curing (Crosslinking Reactions)Literally translated, the term “crosslinking“ means “cross networking”. In the chemical context, it is used for reactions in which molecules are linked together by introducing covalent bonds and forming three-dimensional networks.curing of the glue. This process leads to a rise in stiffness (green curve).
The sharp increase in Complex Shear Modulus (G*)Shear modulus is a measurement of the stiffness of a material. complex shear modulus at the very beginning of the measurement indicates the start of the two-step curing of the sample. Between both steps, the slight decrease in Complex ModulusThe complex modulus consists of two components, the storage and the loss moduli. The storage modulus (or Young’s modulus) describes the stiffness and the loss modulus describes the damping (or viscoelastic) behavior of the corresponding sample using the method of Dynamic Mechanical Analysis (DMA). complex modulus is due to the domination of the temperature effect over the curing effect: a higher temperature leads to a lower stiffness. The reaction has nearly finished after the 5-minute IsothermalTests at controlled and constant temperature are called isothermal.isothermal step. Subsequent cooling is performed to detect the maximum operating temperature given by the Glass Transition TemperatureThe glass transition is one of the most important properties of amorphous and semi-crystalline materials, e.g., inorganic glasses, amorphous metals, polymers, pharmaceuticals and food ingredients, etc., and describes the temperature region where the mechanical properties of the materials change from hard and brittle to more soft, deformable or rubbery.glass transition temperature. During cooling to 25°C, the Complex Shear Modulus (G*)Shear modulus is a measurement of the stiffness of a material. complex shear modulus increases again by more than two orders of magnitude between 45°C and 25°C. This is due to the Glass Transition TemperatureThe glass transition is one of the most important properties of amorphous and semi-crystalline materials, e.g., inorganic glasses, amorphous metals, polymers, pharmaceuticals and food ingredients, etc., and describes the temperature region where the mechanical properties of the materials change from hard and brittle to more soft, deformable or rubbery.glass transition temperature of the cured resin.
The curing profiles as well as the detection of the Glass Transition TemperatureThe glass transition is one of the most important properties of amorphous and semi-crystalline materials, e.g., inorganic glasses, amorphous metals, polymers, pharmaceuticals and food ingredients, etc., and describes the temperature region where the mechanical properties of the materials change from hard and brittle to more soft, deformable or rubbery.glass transition are also shown by displaying the elastic and viscous shear moduli and the phase angle (Figure 2).
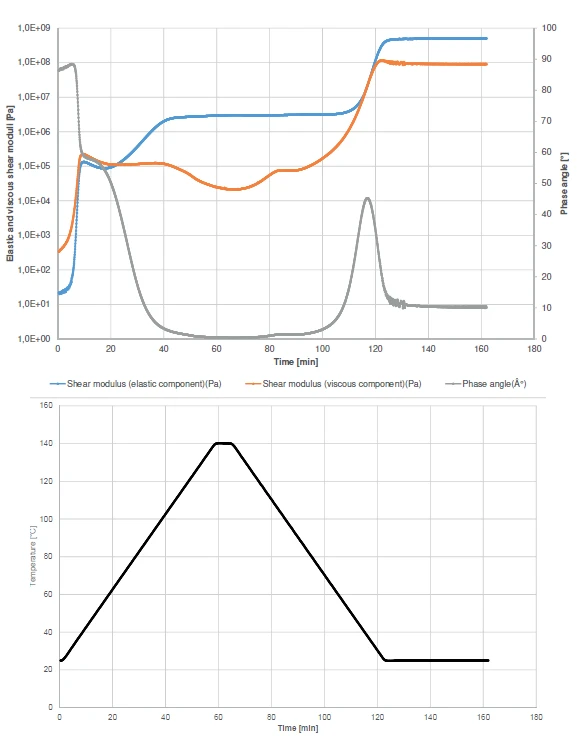
At the beginning of the experiment, the viscous component (orange curve) overcomes the elastic component (blue curve). This behavior can also be observed withfrom the phase angle (grey curve). It is to nearly 90° at the beginning of the experiment, which means that the sample has almost only liquid-like properties under these measurement conditions. The increase in the Elastic modulusThe complex modulus (elastic component), storage modulus, or G’, is the “real” part of the samples the overall complex modulus. This elastic component indicates the solid like, or in phase, response of the sample being measurement. elastic modulus curve at the very beginning of the test correlates with the curing start. It runs in two steps, as can be seen from the two increase steps in the elastic component curve or from the two-step decrease in the phase angle curve. After the first step, the sample will still behave like a fluid due to the Viscous modulusThe complex modulus (viscous component), loss modulus, or G’’, is the “imaginary” part of the samples the overall complex modulus. This viscous component indicates the liquid like, or out of phase, response of the sample being measurement. viscous modulus having a higher value than the Elastic modulusThe complex modulus (elastic component), storage modulus, or G’, is the “real” part of the samples the overall complex modulus. This elastic component indicates the solid like, or in phase, response of the sample being measurement. elastic modulus. As such, the sample will still have the tendency to flow under the timescales of the applied oscillation frequency. This means, that in practice, the parts are gluing together, but can still be shifted on these timescales.
Crossover of the elastic and viscous components is detected at 67°C. From this temperature onward, the solid-like properties of the adhesive dominate the liquidlike properties.
During cooling, the Glass Transition TemperatureThe glass transition is one of the most important properties of amorphous and semi-crystalline materials, e.g., inorganic glasses, amorphous metals, polymers, pharmaceuticals and food ingredients, etc., and describes the temperature region where the mechanical properties of the materials change from hard and brittle to more soft, deformable or rubbery.glass transition occurs which explains the increase in the elastic and viscous moduli and the peak in the phase angle at 34.4°C.
For temperatures below the Glass Transition TemperatureThe glass transition is one of the most important properties of amorphous and semi-crystalline materials, e.g., inorganic glasses, amorphous metals, polymers, pharmaceuticals and food ingredients, etc., and describes the temperature region where the mechanical properties of the materials change from hard and brittle to more soft, deformable or rubbery.glass transition temperature, the polymer chains are in an amorphous, glassy state, freezing their mobility along their main axis. If the Glass Transition TemperatureThe glass transition is one of the most important properties of amorphous and semi-crystalline materials, e.g., inorganic glasses, amorphous metals, polymers, pharmaceuticals and food ingredients, etc., and describes the temperature region where the mechanical properties of the materials change from hard and brittle to more soft, deformable or rubbery.glass transition temperature of the cured sample is lower than the final curing temperature of 140°C, then the curing reaction goes on as long as the temperature is higher than the Glass Transition TemperatureThe glass transition is one of the most important properties of amorphous and semi-crystalline materials, e.g., inorganic glasses, amorphous metals, polymers, pharmaceuticals and food ingredients, etc., and describes the temperature region where the mechanical properties of the materials change from hard and brittle to more soft, deformable or rubbery.glass transition temperature and reaches the maximum possible network DensityThe mass density is defined as the ratio between mass and volume. density for these measurement conditions. As soon as the temperature is lower than the Glass Transition TemperatureThe glass transition is one of the most important properties of amorphous and semi-crystalline materials, e.g., inorganic glasses, amorphous metals, polymers, pharmaceuticals and food ingredients, etc., and describes the temperature region where the mechanical properties of the materials change from hard and brittle to more soft, deformable or rubbery.glass transition temperature, the reaction stops.
Kinetic Analysis of the Curing Reaction
The Kinetics Neo software allows for the determination of the kinetic parameters of a chemical reaction. It is also possible to predict the complex viscosity from rheological measurements. Measurements are carried out at different heating rates (or different IsothermalTests at controlled and constant temperature are called isothermal.isothermal temperatures). Using those different measurements, Kinetics Neo is capable of determining the number of steps describing the curing reaction. For each of those steps, the software also calculates the kinetic parameters, i.e., reaction type, activation energy and order of reaction. Table 2 displays the measurement conditions of the measurements.
Table 2: Measurement conditions of the kinetic analysis
| Device | Kinexus ultra+ |
| Geometry | Disposable parallel plates, 8 mm diameter (PP8) |
| Measurement gap | 1 mm |
| Temperature program | Room temperature to 120°C/140°C |
| Heating rate | 1, 2 and 5 K/min |
| Frequency | 1 Hz |
Figure 3 depicts the measurements carried out at different heating rates. Because the rheological measurements already indicate a two-step reaction, a model with two consecutive steps is selected for kinetic analysis.
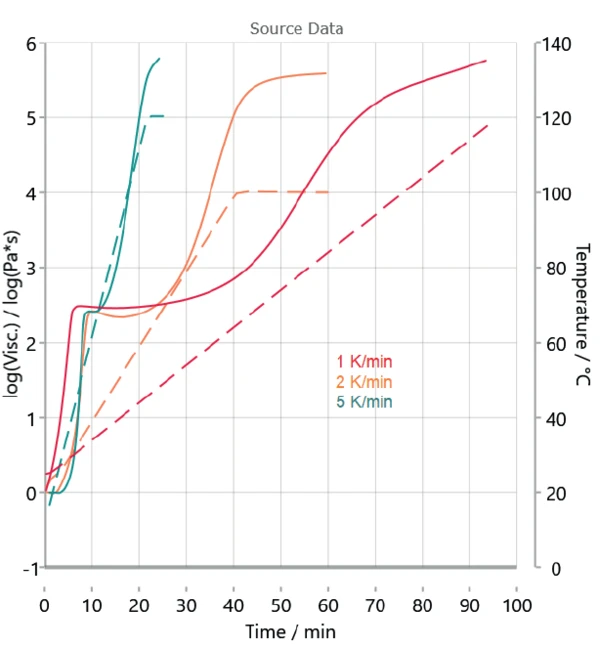
Figure 4 displays the measured curves and the corresponding calculated curves by Kinetics Neo. Table 3 depicts the kinetic parameters used for the calculation. The poor overlap between the measured and calculated curves at the first step shows the differences in sample preparation. However, the high coefficient of correlation of more than 0.99 allows for a kinetic evaluation.
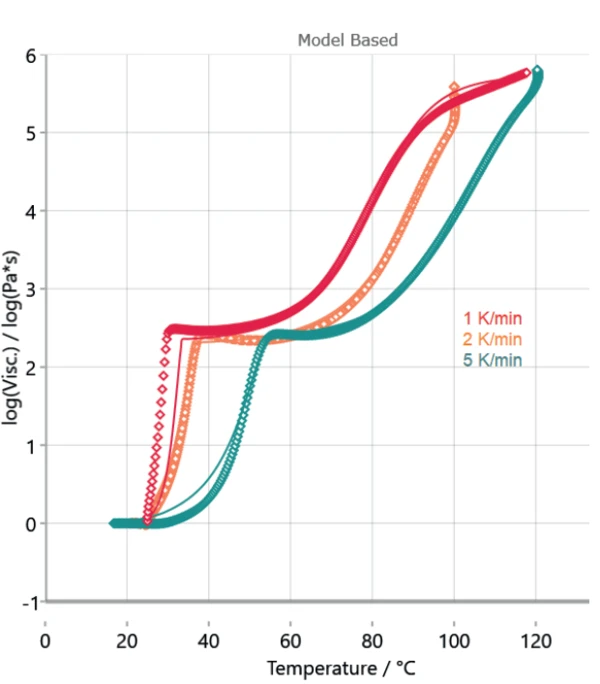
Table 3: Kinetic parameters calculated by Kinetics Neo
| Step 1 | Step 2 | |
| Reaction type | nth order with autocatalysis | nth order with autocatalysis |
| Activation energy [kJ/mol] | 16.996 | 73.611 |
| Log (PreExponentialFactor) [Log 1/s] | -0.631 | 7.676 |
| Reaction order | 0.369 | 1.604 |
| Log (AutocatalysisPreExponentialFactor) | 1.466 | 0.548 |
| Contribution | 0.406 | 0.592 |
Simulation of Curing for User-Specific Conditions
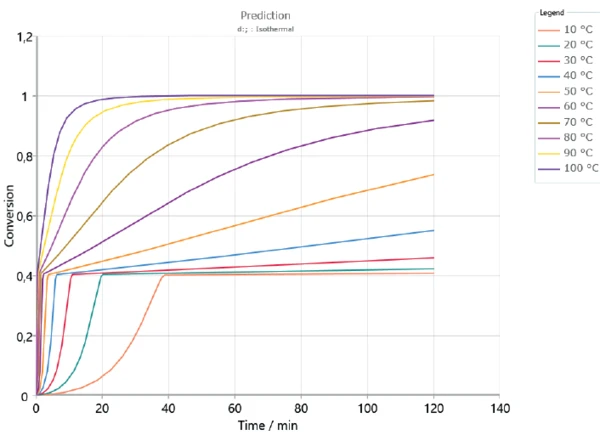
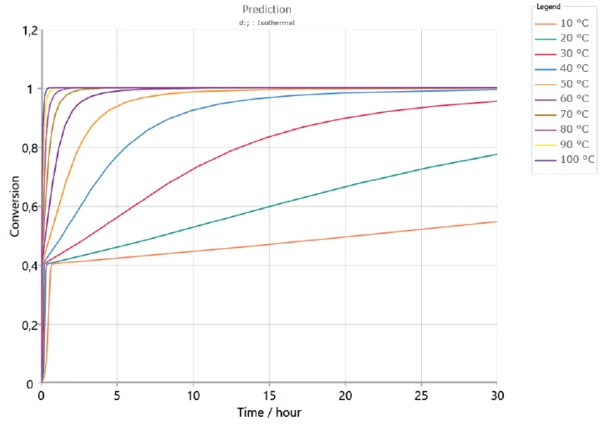
Based on the determined kinetics parameters, Kinetics Neo is capable of calculating the sample’s behavior for any time/temperature condition. As an example, figures 5 and 6 depict the curing behavior of the sample at different IsothermalTests at controlled and constant temperature are called isothermal.isothermal temperatures over 2 hours and 30 hours, respectively. As expected, curing occurs faster at higher temperatures. The first curing step, corresponding to a conversion rate of approx. 40%, is reached in the first minutes for all displayed temperatures. However, a longer period of time is needed to ensure complete curing of the adhesive. It can take several days depending on temperature.
Comparison of the Simulated Curve by Kinetics Neoand the Curve Measured by Kinexus
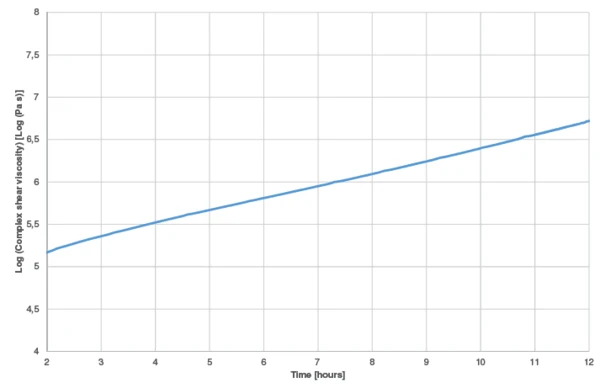
In order to check the validity of the kinetics model to the results obtained by the experiments, a new measurement was carried out at 30°C during 12 hours. The results were compared with the complex shear viscosity curves calculated by Kinetics Neo.
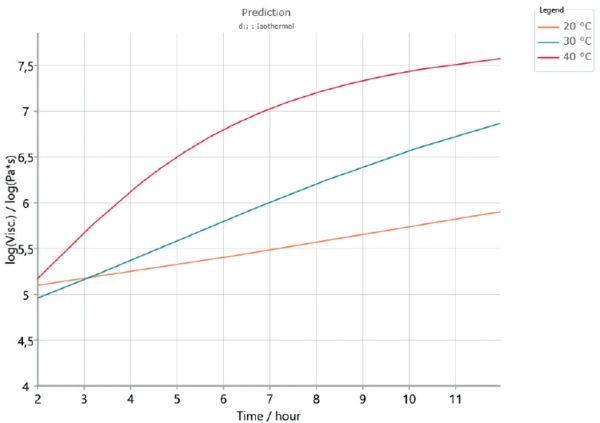
The measured complex shear viscosity curve is displayed in figure 7. The curve obtained by means of Kinetics Neo at an IsothermalTests at controlled and constant temperature are called isothermal.isothermal at 30°C is given in figure 8 (green curve). The start of the reaction is not shown because it contains the uncertainty due to sample preparation (mixing of both components). Between 2 and 12 hours, curing leads to an increase of nearly 1.5 decades for both the measured and calculated curves. This shows the good correlation of the results.
Conclusion
The rheological curing profile of a 2-part epoxy resin was recorded by a Kinexus rotational rheometer. Measurements at different heating rates were carried out with the results imported into Kinetics Neo to determine the kinetics of the reaction. This powerful software goes further, as it can also predict the sample’s behavior at any operating time/temperature condition.
Acknowledgement
We would like to thank Dr. Adrian Hill (NETZSCH UK) for the many interesting discussions.