Introduction
Heating liquids in a thermobalance, the vapor pressure of the liquid also rises as the heating rate increases. The evaporation rate – the rate at which the liquid changes into the gas phase – rises with increasing temperatures. The mass-loss rate, allowing tracking of evaporation in a thermobalance, increases to the same degree. The thermobalance can be operated under normal pressure in a purge gas flow flushing the forming gases out of the sample chamber.
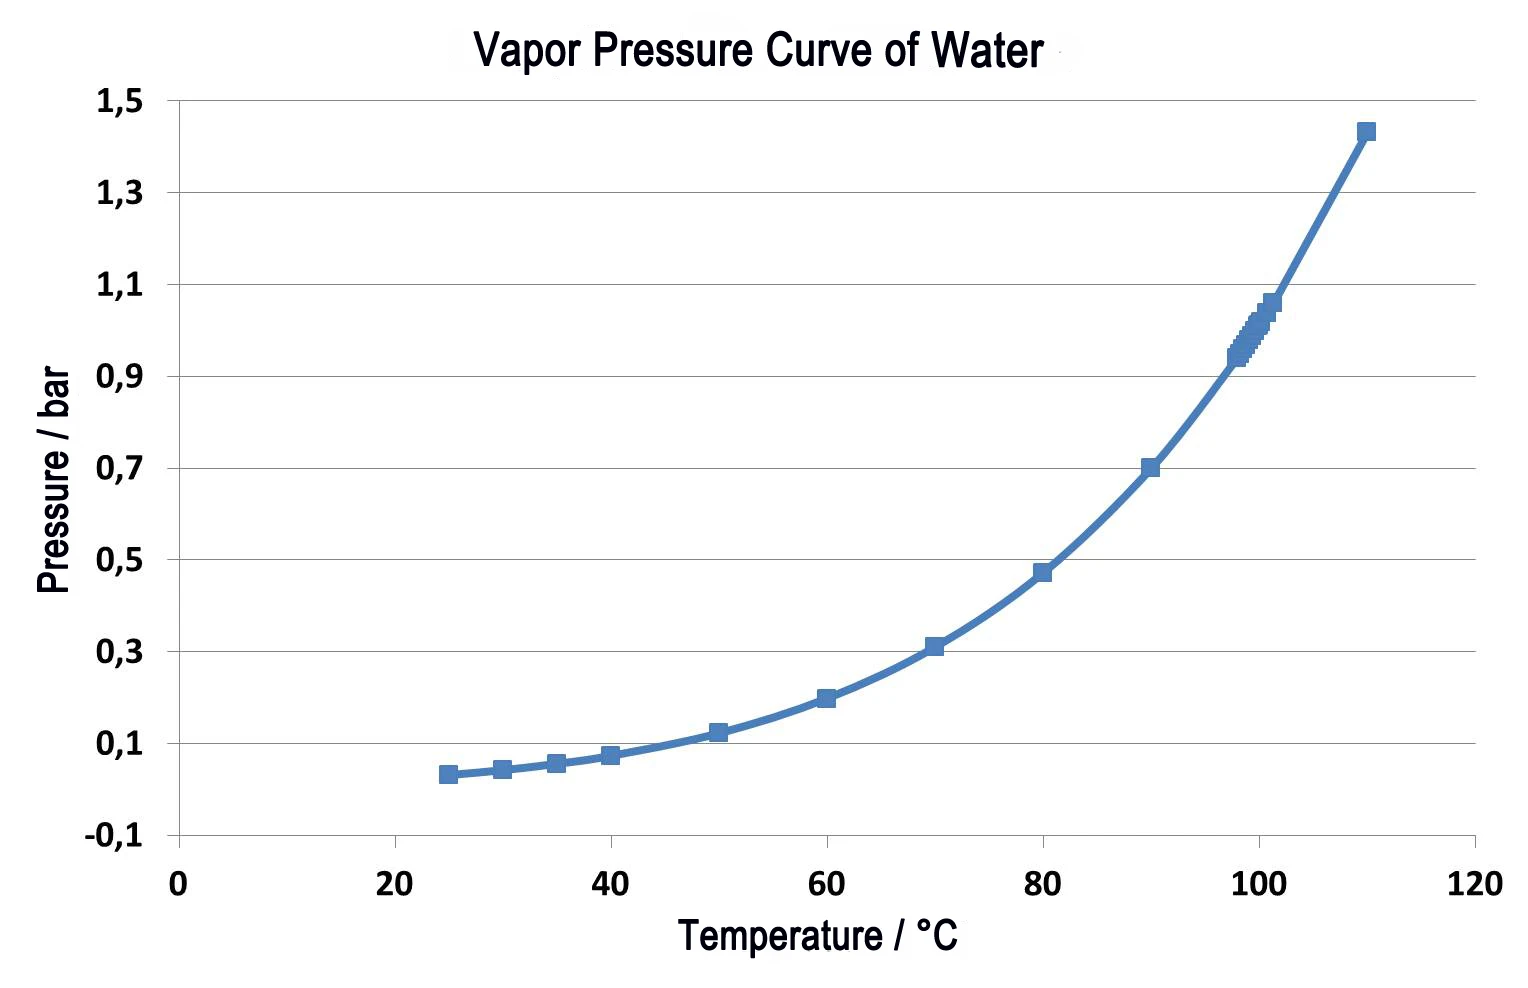
A liquid boils when the vapor pressure of the liquid corresponds to ambient pressure. Under normal pressure (1013 mbar), water boils at 100°C since the vapor pressure also amounts to 1013 mbar. If the ambient pressure changes, the boiling temperature will also change. Figure 1 presents this correlation for water for the temperature range between room temperature and 110°C [1].
As can clearly be seen in figure 1, water boils already at 50°C if the ambient pressure of 1013 mbar is reduced to 123 mbar. This correlation is used in applications such as vacuum drying, in that the material to be dried is exposed to sub-ambient pressure, and the liquids (usually water) can then evaporate gently at low temperatures. This technique is used particularly often in the food sector.
There is also a correlation similar to the described reduction of the boiling point for liquids – albeit in slightly weaker form – for the sublimation and Decomposition reactionA decomposition reaction is a thermally induced reaction of a chemical compound forming solid and/or gaseous products. decomposition of solids.

Measurement Conditions
| Sample | SEBS | SEBS |
|---|---|---|
| Weight | 8.635 mg | 10.130 mg |
| Crucible | Al2O3 | Al2O3 |
| Atmosphere | Nitrogen | Vacuum |
| Gas flow rate | 40 ml/min | 0 ml/min |
| Heating rate | 5 K/min | 5 K/min |
Thermogravimetric Investigations under Reduced Pressure
As with the boiling process, other reactions in which gaseous substances are released are also similarly dependent upon the ambient pressure. The temperature ranges of Decomposition reactionA decomposition reaction is a thermally induced reaction of a chemical compound forming solid and/or gaseous products. decomposition reactions also shift to lower values with decreasing ambient pressure. This temperature shift varies depending upon the process or substance. In turn, this means that the application of a negative-pressure atmosphere may influence the release of gaseous Decomposition reactionA decomposition reaction is a thermally induced reaction of a chemical compound forming solid and/or gaseous products. decomposition products for different reactions to varying degrees. This procedure can be particularly beneficial if thermal degradation processes are overlapped; i.e., if they occur in very close temporal proximity to one another. Reduction of the ambient pressure can then effectuate an improved separation of the overlapping events.
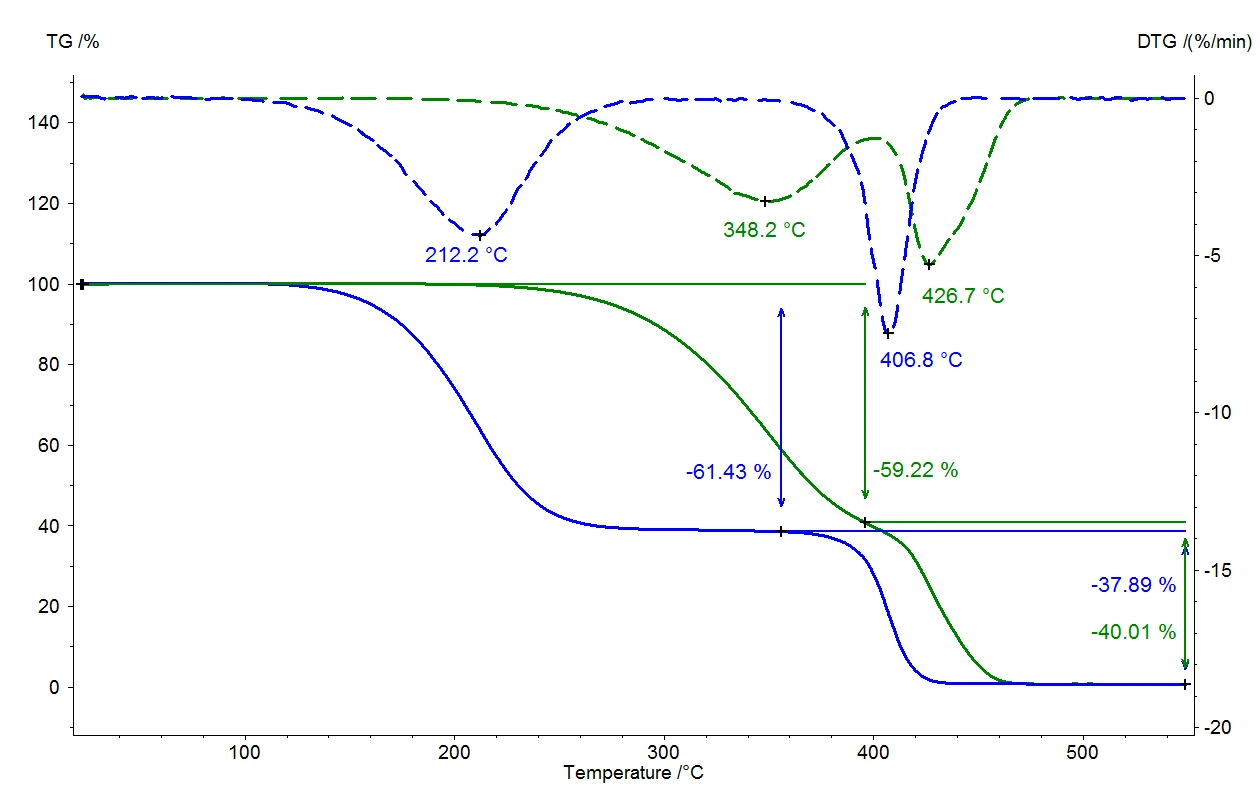
Figure 2 shows the comparison of two measurements on a thermoplastic elastomer. The solid lines represent the relative mass change as a function of temperature. The green curve depicts the measurement results under normal pressure at a purge gas rate of 40 ml/min in nitrogen. Two mass-loss steps can be seen; these are overlapping even at the low heating rate of 5 K/min. Quantification of the steps is difficult in this case. If this investigation is carried out in a vacuum - at the same heating rate of 5 K/min (blue curve) – all release temperatures are shifted to lower values than in the measurement under normal pressure. The end of the reaction is reached at 480°C under normal pressure, but in a vacuum, the reaction is already finished at 440°C. The dotted curves (DTG) show the first derivative for each of the relative mass changes (TG). The DTG results indicate the mass-loss rate and are therefore a measure for the reaction rate. The temperatures of the maximum mass-loss rates (DTG maxima) confirm that both partial reactions are shifted to lower temperatures when occurring in a vacuum. However, since the first partial reaction (348°C to 212°C) is shifted to considerably lower temperatures than the second one (427°C to 407°C), the two partial reactions are better separated. Quantification of the two mass-loss steps is thereby facilitated considerably.
