Introduction
Hyaluronic acid (HA) is a naturally occurring polysaccharide frequently used as a functional ingredient in many topical and subcutaneous anti-ageing treatments such as dermal fillers, which exploit the polymer’s unique viscoelastic properties for effective soft tissue augmentation. When administered subcutaneously, HA builds an elastic network within wrinkles and rhytides to give the skin a plumper and fuller look. Naturally occurring HA has a half-life of less than three days so increasing the durability of the polymer is essential to developing products with greater clinical persistence and an acceptable shelf life. Increasing both the molecular weight (MW) and degree of cross-linking of the polymer is a proven strategy for improving mechanical strength and extending degradation times. However, these characteristics also impact other properties of the HA such as viscosity and viscoelasticity.
To formulate successfully with HA, it is essential to understand the impact of factors such as molecular weight, molecular structure, concentration and degree of crosslinking on rheological characteristics such as viscoelasticity, which are directly linked to aspects of product performance. Linking structural characteristics to product performance, via rheological properties, supports smart, fast, and effective formulation.
The following study shows how rheology and particle size measurements can be used to characterize the physical properties of HA dermal fillers.
Experimental
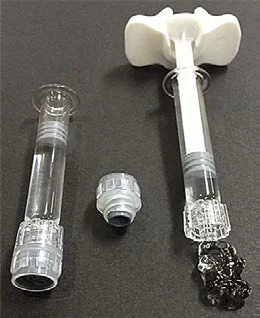
- Three commercial HA dermal fillers were evaluated using rotational rheometry and laser diffraction for characterization of rheological behavior and particle size respectively.
- Rotational rheometer measurements were made using a Kinexus rotational rheometer with a Peltier plate cartridge and using a 40 mm parallel plate measuring system. All rheology measurements were performed at 25°C.
- A standard loading sequence was used to ensure that both samples were subject to a consistent and controllable loading protocol.
- Oscillation testing included variable amplitude and variable frequency tests. Amplitude sweep tests at a frequency of 1 Hz were performed to determine the Linear Viscoelastic Region (LVER)In the LVER, applied stresses are insufficient to cause structural breakdown (yielding) of the structure and hence important micro-structural properties are being measured.linear viscoelastic region (Linear Viscoelastic Region (LVER)In the LVER, applied stresses are insufficient to cause structural breakdown (yielding) of the structure and hence important micro-structural properties are being measured.LVER) and critical StrainStrain describes a deformation of a material, which is loaded mechanically by an external force or stress. Rubber compounds show creep properties, if a static load is applied.strain. Subsequent frequency sweep tests were performed between 0.1 - 10 Hz using a constant StrainStrain describes a deformation of a material, which is loaded mechanically by an external force or stress. Rubber compounds show creep properties, if a static load is applied.strain within the Linear Viscoelastic Region (LVER)In the LVER, applied stresses are insufficient to cause structural breakdown (yielding) of the structure and hence important micro-structural properties are being measured.LVER.
- Steady state shear measurements were made to check the viscosity dependence on shear rate (0.1 s-1 - 100 s-1) and a StressStress is defined as a level of force applied on a sample with a well-defined cross section. (Stress = force/area). Samples having a circular or rectangular cross section can be compressed or stretched. Elastic materials like rubber can be stretched up to 5 to 10 times their original length.stress ramp test (0 Pa - 200 Pa in 100 s) was also performed to determine the Yield StressYield stress is defined as the stress below which no flow occurs; literally behaves like a weak solid at rest and a liquid when yielded.yield stress of the fillers.
- The TackinessTackiness describes the interaction between 2 layers of identical (autohesion) or different (cohesion) materials in terms of surface stickiness.tackiness of the fillers were assessed using axial testing on the rheometer which involved changing the gap rapidly from 1 mm to 20 mm and recording the normal force profile. Tack was correlated with the peak normal force measured in Newtons.
- Particle size measurements of the gel particles in the dermal fillers were made using a Malvern Mastersizer 3000. The fillers were dispersed in saline solution and the median particle size and particle size distribution determined.
Results and Discussion
Oscillation Testing
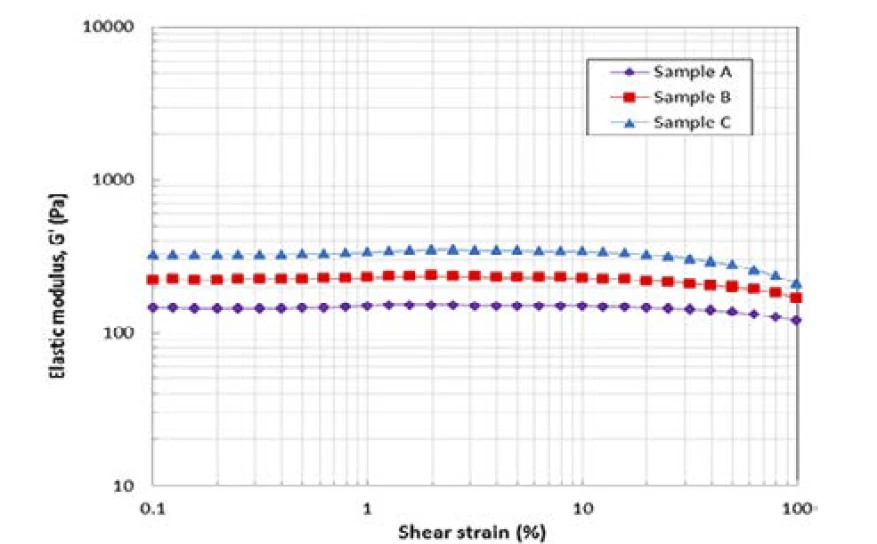
The Elastic modulusThe complex modulus (elastic component), storage modulus, or G’, is the “real” part of the samples the overall complex modulus. This elastic component indicates the solid like, or in phase, response of the sample being measurement. elastic modulus curves as a function of shear StrainStrain describes a deformation of a material, which is loaded mechanically by an external force or stress. Rubber compounds show creep properties, if a static load is applied.strain are shown in Figure 2. All samples had similar size Linear Viscoelastic Region (LVER)In the LVER, applied stresses are insufficient to cause structural breakdown (yielding) of the structure and hence important micro-structural properties are being measured.LVER regions with a critical StrainStrain describes a deformation of a material, which is loaded mechanically by an external force or stress. Rubber compounds show creep properties, if a static load is applied.strain representing the onset of non-linearity in the region of 20%. Elastic modulusThe complex modulus (elastic component), storage modulus, or G’, is the “real” part of the samples the overall complex modulus. This elastic component indicates the solid like, or in phase, response of the sample being measurement. Elastic modulus values measured within the Linear Viscoelastic Region (LVER)In the LVER, applied stresses are insufficient to cause structural breakdown (yielding) of the structure and hence important micro-structural properties are being measured.LVER showed that Sample A had the lowest elastic stiffness with G’ having a value of 150 Pa. Sample C was the most elastically stiff of the three samples with a G’ value of 320 Pa with Sample B having a value between the two of 220 Pa.
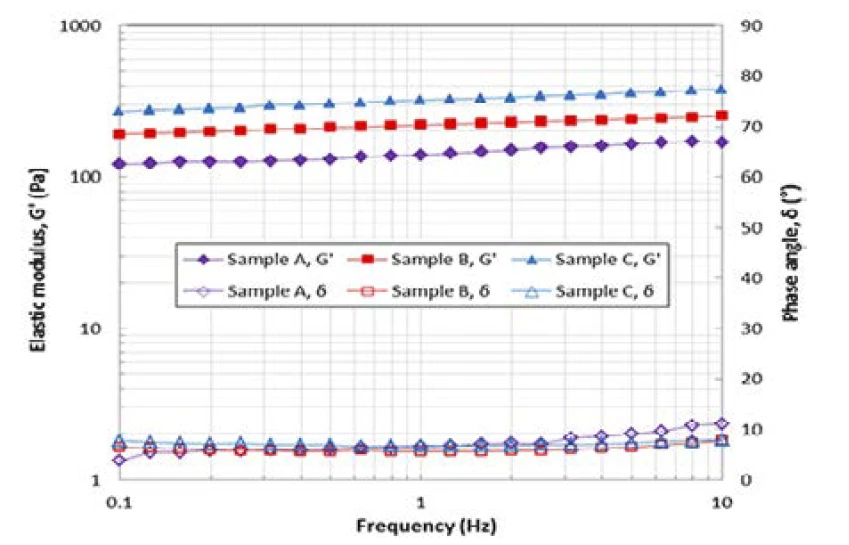
The Elastic modulusThe complex modulus (elastic component), storage modulus, or G’, is the “real” part of the samples the overall complex modulus. This elastic component indicates the solid like, or in phase, response of the sample being measurement. elastic modulus and phase angle curves as a function of the oscillation frequency are shown in Figure 3. The phase angle for all samples across the whole frequency range is around 10° suggesting all samples are highly elastic gels. The values of G’ for the samples A, B, and C at 1Hz are about 150Pa, 220Pa and 320Pa, respectively, which correlate with the amplitude sweep data at the same frequency. The slight slope in G’ with frequency suggests a small amount of structural RelaxationWhen a constant strain is applied to a rubber compound, the force necessary to maintain that strain is not constant but decreases with time; this behavior is known as stress relaxation. The process responsible for stress relaxation can be physical or chemical, and under normal conditions, both will occur at the same time. relaxation where stored elastic energy is dissipated with increasing time (decreasing frequencies) although this is relatively minimal.
There are many factors that affect the viscoelastic properties of HA dermal fillers including HA concentration, molecular weight and crosslinking degree. By changing these characteristics, the viscoelastic properties, especially the Elastic modulusThe complex modulus (elastic component), storage modulus, or G’, is the “real” part of the samples the overall complex modulus. This elastic component indicates the solid like, or in phase, response of the sample being measurement. elastic modulus G’, can be engineered for a specific application. Gels with high G’ give higher resistance to deformation and should be more effective as fillers but could be harder to inject and may give more pain. Therefore, strong gels with high G’ may be more suitable to use for deeper or more serious wrinkles. On the other hand, weaker gels with low G’ may be better for fine or light wrinkles found in lips or tear troughs, which are more sensitive, because they would cause less pain when injected. The lower modulus may also better match the properties of the local tissue. Of the three HA samples tested it can be said that sample A is the weakest and softest gel and sample C is the stiffest and strongest gel based on results presented in Figures 2 and 3.
Steady Shear Testing and Yield StressYield stress is defined as the stress below which no flow occurs; literally behaves like a weak solid at rest and a liquid when yielded.Yield Stress Determination
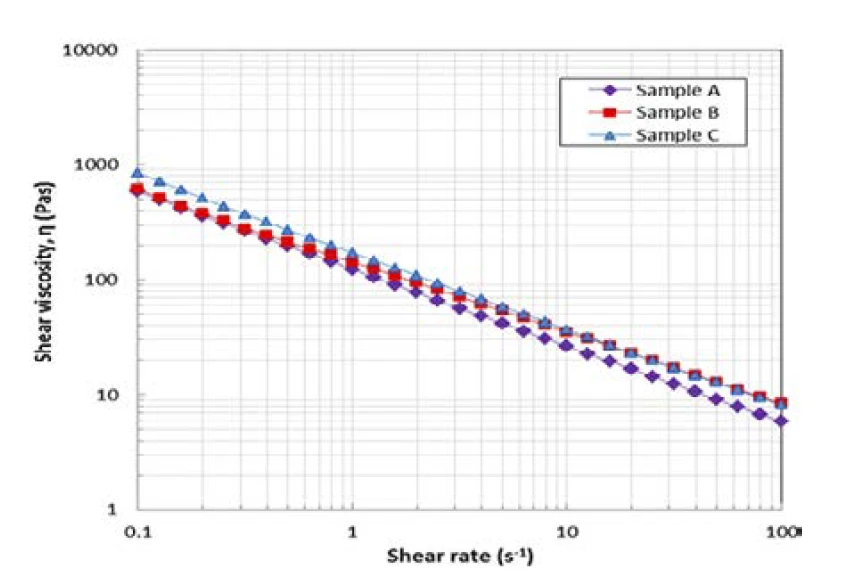
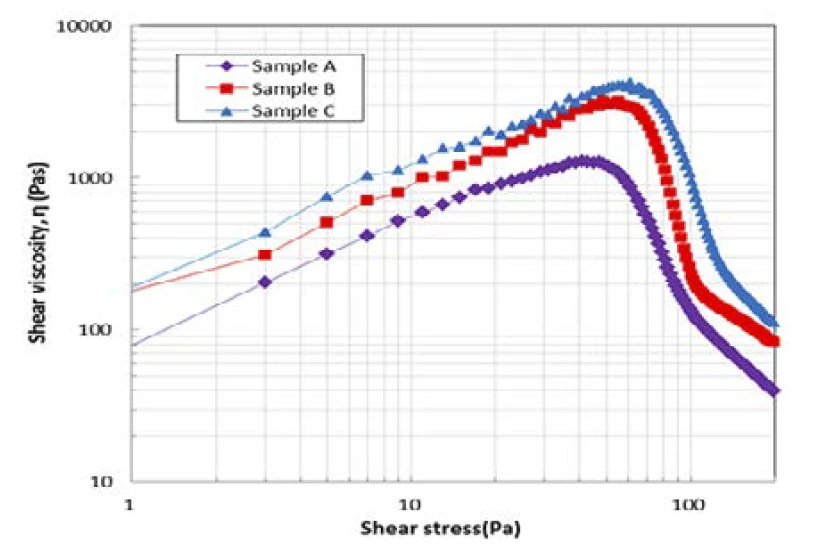
The results of the steady state shear measurement – shear viscosity measured as a function of shear rate are shown in Figure 4. The viscosity decreases significantly with increasing shear rate indicating that the materials are highly Shear ThinningThe most common type of non-Newtonian behavior is shear thinning or pseudoplastic flow, where the fluid viscosity decreases with increasing shear.shear thinning. Also, the structure of the fillers is so strong that at a low shear rate the viscosity is very high and continues to rise with decreasing shear rate suggesting Yield StressYield stress is defined as the stress below which no flow occurs; literally behaves like a weak solid at rest and a liquid when yielded.yield stress or solid like behavior at rest. This corresponds with observations from oscillation testing which showed a highly elastic gel-like structure. A Yield StressYield stress is defined as the stress below which no flow occurs; literally behaves like a weak solid at rest and a liquid when yielded.yield stress indicates that the material will behave like a solid below critical StressStress is defined as a level of force applied on a sample with a well-defined cross section. (Stress = force/area). Samples having a circular or rectangular cross section can be compressed or stretched. Elastic materials like rubber can be stretched up to 5 to 10 times their original length.stress but will flow like a liquid above this critical StressStress is defined as a level of force applied on a sample with a well-defined cross section. (Stress = force/area). Samples having a circular or rectangular cross section can be compressed or stretched. Elastic materials like rubber can be stretched up to 5 to 10 times their original length.stress. The magnitude of the Yield StressYield stress is defined as the stress below which no flow occurs; literally behaves like a weak solid at rest and a liquid when yielded.yield stress should be related to the structural strength and hence degree of cross-linking and concentration of the gel particles, which should be reflected in G’.
Yield StressStress is defined as a level of force applied on a sample with a well-defined cross section. (Stress = force/area). Samples having a circular or rectangular cross section can be compressed or stretched. Elastic materials like rubber can be stretched up to 5 to 10 times their original length.stress can be determined using a number of different tests, however, a StressStress is defined as a level of force applied on a sample with a well-defined cross section. (Stress = force/area). Samples having a circular or rectangular cross section can be compressed or stretched. Elastic materials like rubber can be stretched up to 5 to 10 times their original length.stress ramp is one of the quickest and easiest ways for estimating the Yield StressYield stress is defined as the stress below which no flow occurs; literally behaves like a weak solid at rest and a liquid when yielded.yield stress, where the instantaneous viscosity (not steady state) is measured continuously with increasing shear StressStress is defined as a level of force applied on a sample with a well-defined cross section. (Stress = force/area). Samples having a circular or rectangular cross section can be compressed or stretched. Elastic materials like rubber can be stretched up to 5 to 10 times their original length.stress. StressStress is defined as a level of force applied on a sample with a well-defined cross section. (Stress = force/area). Samples having a circular or rectangular cross section can be compressed or stretched. Elastic materials like rubber can be stretched up to 5 to 10 times their original length.Stress ramp data for the three HA samples are shown in Figure 5. The peak in viscosity represents the point of yield and the StressStress is defined as a level of force applied on a sample with a well-defined cross section. (Stress = force/area). Samples having a circular or rectangular cross section can be compressed or stretched. Elastic materials like rubber can be stretched up to 5 to 10 times their original length.stress value at which this occurs is the yield StressStress is defined as a level of force applied on a sample with a well-defined cross section. (Stress = force/area). Samples having a circular or rectangular cross section can be compressed or stretched. Elastic materials like rubber can be stretched up to 5 to 10 times their original length.stress. Sample A has the lowest yield StressStress is defined as a level of force applied on a sample with a well-defined cross section. (Stress = force/area). Samples having a circular or rectangular cross section can be compressed or stretched. Elastic materials like rubber can be stretched up to 5 to 10 times their original length.stress (42 Pa) and Sample C the highest (55 Pa) with Sample B slightly lower than C (53 Pa). This is the same order observed in oscillation testing with Sample C the strongest and Sample A the weakest of the three gels. As these gels tend to exists as a collection of covalently cross-linked gel particles (as opposed to a continuous gel network), then the yield StressStress is defined as a level of force applied on a sample with a well-defined cross section. (Stress = force/area). Samples having a circular or rectangular cross section can be compressed or stretched. Elastic materials like rubber can be stretched up to 5 to 10 times their original length.stress is associated with the stress required to ‘un-jam’ the particles and allow them to move past one another.
Tack Testing
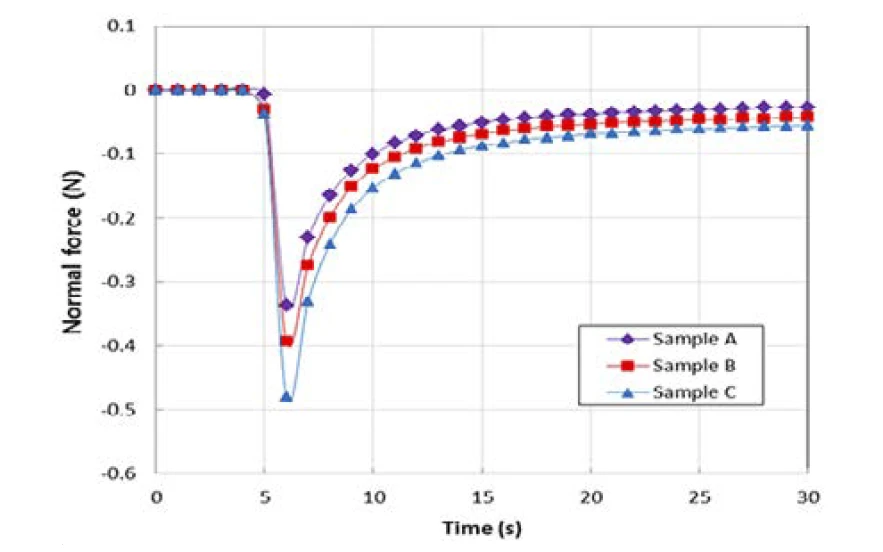
The normal force profiles as a function of time as the plate-plate gap is increased are shown in Figure 6. The normal force value is negative because the sample is pulling down on the upper plate due to adhesive/cohesive forces and decays towards zero at failure; the residual force at long times is due to the weight of the retained samples on the upper plate. The peak normal force for samples A, B, and C are 0.35 N, 0.46 N, and 0.54 N, respectively, which again correlate with the order of G’ and Yield stress measurements for the three samples. Hence, Sample C has the highest degree of tack or cohesivity and Sample A the least.
Particle Size
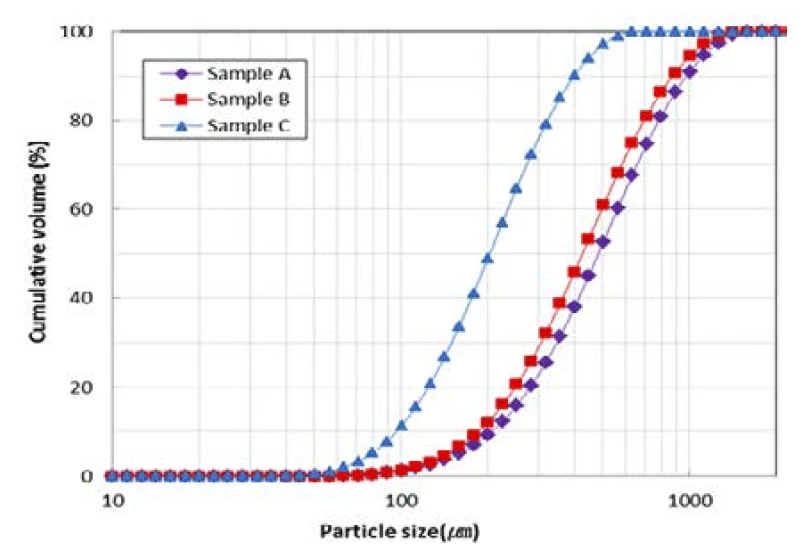
Particle size of the gel particles needs to be controlled in order to reduce the extrusion force and associated side effects like pain and bleeding when gels are injected. Therefore, the gels need to be engineered to pass through needles at the appropriate rate with the desired extrusion force. In Figure 7, particle size distribution of gels is shown as a cumulative volume percent. The median size (Dv50) of samples A, B, and C is 480 μm, 425 μm, and 203 μm. Strong gels with high G’ and yield stress values need to be sized to small particles to be easily injected through the needles. Sample C has the smallest particle size because it has the highest G’ value in the samples. On the other hand, sample A has the largest particle size as it is the weakest gels in the samples (it can be easily passed through the needles). The resulting size will also be related to the extent of cross-linking and molecular weight since highly cross-linked polymers associated with higher values of G’ will be denser and more compact.
Conclusion
Rheological properties and particle size of three commercial HA based dermal fillers were characterized and compared. The Elastic modulusThe complex modulus (elastic component), storage modulus, or G’, is the “real” part of the samples the overall complex modulus. This elastic component indicates the solid like, or in phase, response of the sample being measurement. elastic modulus G’ was determined from oscillation testing and those values correlated with gel stiffness and strength (e.g., weak gels or strong gels). Steady-state shear measurements were made to check the viscosity dependence on the shear rate and stress ramp tests were performed to determine the force required to break down the gel structure, i.e., the yield stress. The TackinessTackiness describes the interaction between 2 layers of identical (autohesion) or different (cohesion) materials in terms of surface stickiness.tackiness of the fillers was determined by measuring normal force profile when the plate-plate gap was increasing and correlated with oscillation, and yield stress data. Furthermore, the particle size of gels was measured because the size affects extrusion, and this was found to correlate with rheological data also.
In conclusion, the rheological properties and particle size of HA based dermal fillers are essential parameters to determine the performance (e.g., easy delivery, extrusion force, injection, resistance to deformation, pain reduction) and application (e.g., fine or deep wrinkle, facial con- touring) of these products.