Introduction
Accurate analysis of material properties is essential for optimizing performance and quality in industrial and research settings. The integration of Kinexus rheometry along with Dielectric Analysis (DEA) enables simultaneous assessment of the mechanical and electrical behavior within a single experimental framework. Combining these complementary techniques leads to deeper insight into complex materials, including polymers, composites, and Curing (Crosslinking Reactions)Literally translated, the term “crosslinking“ means “cross networking”. In the chemical context, it is used for reactions in which molecules are linked together by introducing covalent bonds and forming three-dimensional networks.curing systems. This approach allows for comprehensive understanding of the viscoelastic characteristics and dielectric responses, providing valuable data for process development, quality control, and advanced materials research.
Measurement Principle Rotational Rheometry
Rotational rheometry characterizes the viscoelastic properties of a material by measuring its response to an applied deformation under controlled conditions. In a typical oscillation test, the sample is placed between two geometries – commonly parallel plates or a cone-andplate setup. One plate oscillates while the other remains stationary (see Figure 1), imposing a shear force on the sample.

Controlled angular displacement or torque is applied, generating a shear StrainStrain describes a deformation of a material, which is loaded mechanically by an external force or stress. Rubber compounds show creep properties, if a static load is applied.strain, γ(t):

The material responses with a measurable shear StressStress is defined as a level of force applied on a sample with a well-defined cross section. (Stress = force/area). Samples having a circular or rectangular cross section can be compressed or stretched. Elastic materials like rubber can be stretched up to 5 to 10 times their original length.stress:

Here, γ0 is the StrainStrain describes a deformation of a material, which is loaded mechanically by an external force or stress. Rubber compounds show creep properties, if a static load is applied.strain amplitude, ω is angular frequency, τ₀ is the StressStress is defined as a level of force applied on a sample with a well-defined cross section. (Stress = force/area). Samples having a circular or rectangular cross section can be compressed or stretched. Elastic materials like rubber can be stretched up to 5 to 10 times their original length.stress amplitude, and δ is the phase lag between the applied StrainStrain describes a deformation of a material, which is loaded mechanically by an external force or stress. Rubber compounds show creep properties, if a static load is applied.strain and the measured StressStress is defined as a level of force applied on a sample with a well-defined cross section. (Stress = force/area). Samples having a circular or rectangular cross section can be compressed or stretched. Elastic materials like rubber can be stretched up to 5 to 10 times their original length.stress. This phase lag reflects the material’s viscoelastic properties.
Key rheological parameters include the elastic shear modulus (G´), viscous shear modulus (G´´), and complex viscosity (η*). These are derived from the measured StressStress is defined as a level of force applied on a sample with a well-defined cross section. (Stress = force/area). Samples having a circular or rectangular cross section can be compressed or stretched. Elastic materials like rubber can be stretched up to 5 to 10 times their original length.stress and StrainStrain describes a deformation of a material, which is loaded mechanically by an external force or stress. Rubber compounds show creep properties, if a static load is applied.strain responses and indicate the material’s structure.
As the material undergoes changes (such as Curing (Crosslinking Reactions)Literally translated, the term “crosslinking“ means “cross networking”. In the chemical context, it is used for reactions in which molecules are linked together by introducing covalent bonds and forming three-dimensional networks.curing), its ability to resist deformation evolves. The formation of a polymer network increases stiffness and modifies the ratio of the viscous shear modulus, G´´ to the elastic shear modulus, G´ behavior.
Measurement Principle Dielectric Analysis
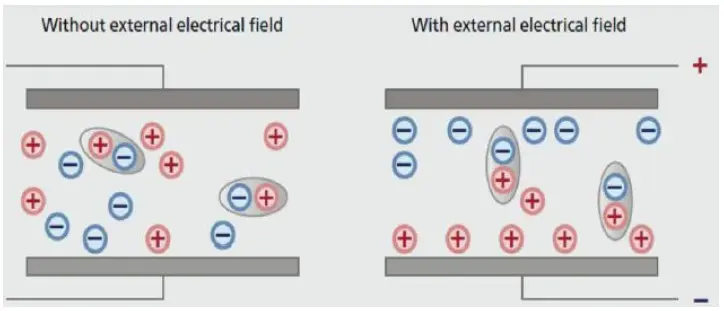
Dielectric analysis (DEA) is used to monitor changes in a material’s dielectric properties during a controlled time/ temperature program. In a typical DEA experiment, the sample is positioned between two electrodes – either parallel plates or interdigitated comb sensors (see Figure 2).
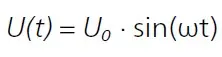
A sinusoidal voltage is applied:
The material responds with an electrical current:

Impurities within the material provide charge carriers that migrate toward the electrodes, while dipolar species (such as monomers or oligomers) orient themselves in the electric field. This behavior results in the measured current.
As Curing (Crosslinking Reactions)Literally translated, the term “crosslinking“ means “cross networking”. In the chemical context, it is used for reactions in which molecules are linked together by introducing covalent bonds and forming three-dimensional networks.curing progresses, a three-dimensional polymer network forms, reducing ion mobility and limiting the ability of dipoles to reorient. This restricts charge-carrier movement and dipole displacement. A key parameter derived from the measurement is the ion conductivity, σ. This ion conductivity depends on the mobility of free charge carriers and on the energy dissipated through dipole reorientation. The Ion ViscosityIon viscosity is the reciprocal value of the ion conductivity, which is calculated from the dielectric loss factor.ion viscosity, ρ, is defined as:
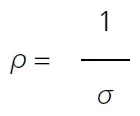
As Curing (Crosslinking Reactions)Literally translated, the term “crosslinking“ means “cross networking”. In the chemical context, it is used for reactions in which molecules are linked together by introducing covalent bonds and forming three-dimensional networks.curing advances, the expanding polymer network lowers the ion conductivity. This corresponds to an increase in Ion ViscosityIon viscosity is the reciprocal value of the ion conductivity, which is calculated from the dielectric loss factor.ion viscosity.
Measurement Conditions
The combined measurement was performed using parallel plate rheometry (diameter: 8 mm) and dielectric analysis (DEA) on UHU Plus Endfest 300 (epoxy glue) at a constant temperature of 60°C. The rheometer operated with a 1% elastic shear StrainStrain describes a deformation of a material, which is loaded mechanically by an external force or stress. Rubber compounds show creep properties, if a static load is applied.strain and a frequency of 1 Hz. The normal force, shear modulus (G´), viscous shearmodulus (G´´), and complex shear viscosity (η*) were recorded as a function of time. The DEA measurement was performed simultaneously, using 100 mHz, 10 Hz, 100 Hz, and 1 kHz excitation frequencies, tracking the log(viscosity) in Ohm·cm over time.
Measurement Results
The rheological measurement shows a typical time-dependent Curing (Crosslinking Reactions)Literally translated, the term “crosslinking“ means “cross networking”. In the chemical context, it is used for reactions in which molecules are linked together by introducing covalent bonds and forming three-dimensional networks.curing profile of the epoxy adhesive at 60°C (Figure 3). Initially, the viscous shear modulus, G´´ is higher than the elastic shear modulus, G´, indicating a liquid-like state for the applied test conditions. As curing progresses, both signals increase, with G´ surpassing G´´ at 57°C, reflecting the transition from a liquid to a gel-like and finally to a solid network. This crossover G´/G´´ corresponds to the gel point for the timescale of the applied frequency (1 Hz).
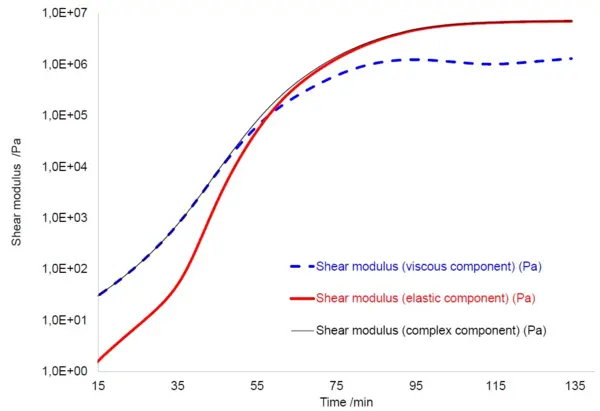
Figure 4 presents the evolution of the complex shear viscosity (rheometer) along with the Ion ViscosityIon viscosity is the reciprocal value of the ion conductivity, which is calculated from the dielectric loss factor.ion viscosity (DEA). The increase in Ion ViscosityIon viscosity is the reciprocal value of the ion conductivity, which is calculated from the dielectric loss factor.ion viscosity measured for all frequencies indicates a decrease in dipolar and ion mobility as crosslinking increases. The plateau indicates the completion of the curing process. The higher the frequency, the more rapid is the plateau reached. At lower frequencies, such as 100 mHz, the signal does not reach a plateau by the end of the measurement, suggesting that the reaction is not yet complete. The frequency dependence of the signals reflects their differing sensitivity to fast and slow segmental motions.
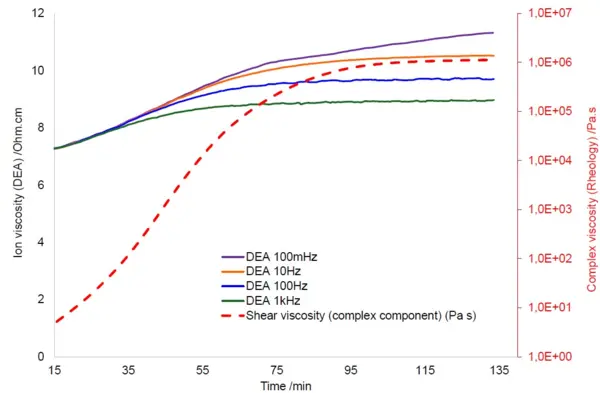
An important aspect of combined analysis is the complementary sensitivity of the two methods. While rheological data provide robust information on network formation and mechanical transitions, rheometry becomes less informative once the sample has become very stiff: the mechanical data tend to plateau, as further network development cannot be resolved through macroscopic deformation. In contrast, dielectric analysis (DEA) remains highly sensitive to ongoing molecular dynamics and changes in ion mobility, even after the sample has become too stiff for mechanical deformation. This is illustrated by the 100-mHz DEA curve, which continues to evolve and indicate ongoing reaction, even when the rheological curve has reached its plateau. Thus, DEA provides valuable additional insight into the later stages of the cure and ensures a more complete picture of the reaction progress.
Conclusion
This application demonstrates the advantage of combining rheometry and DEA for monitoring epoxy curing. The NETZSCH system provides simultaneous mechanical and dielectric data, allowing users to track both macroscopic and molecular-level changes throughout the entire process. While rheometry excels at identifying mechanical transitions and the gel point, DEA continues to deliver detailed information on the reaction's progress, even after the sample has become too stiff for further mechanical probing. As a result, DEA offers unique value by ensuring full visibility of the ongoing curing, supporting process optimization and ensuring high-quality, fully cured products.