Introduction
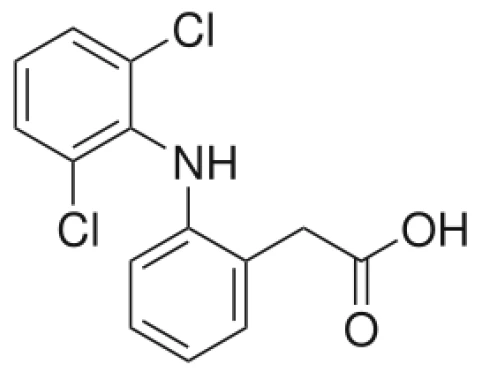
Diclofenac is an anti-inflammatory drug with analgesic and antipyretic properties. Its consumption can lead to gastrointestinal complaints as well as headache or raised blood pressure. Heavy side effects can occur if this drug is taken over the long term. In medicines, diclofenac is available in the form of, for example, sodium or potassium salt. [2] The degradation of diclofenac sodium was investigated by means of TGA coupled with FT-IR and will be discussed in the following.
Test Results
11.12 mg of diclofenac sodium was prepared in an aluminum oxide crucible and placed in the TG 209 F1 Libra®. The sample was heated to 600°C at a controlled rate of 10 K/min under a dynamic nitrogen atmosphere (40 ml/min). The gases evolved during heating were directly injected into the FT-IR spectrometer via the PERSEUS® coupling.
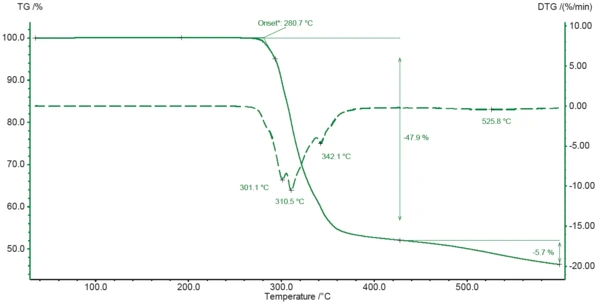
The TGA curve of diclofenac sodium during heating to 600°C is depicted in Figure 2. Degradation of the sample begins at 281°C (extrapolated onset of the TGA curve) and leads to an initial mass loss of 48% between room temperature and 425°C. It can be concluded from the minima in the DTG curve that the process runs in different successive steps (301°C, 311°C and 342°C). Degradation continues until the end of the measurement with another mass loss of 6% between 425°C and 600°C.
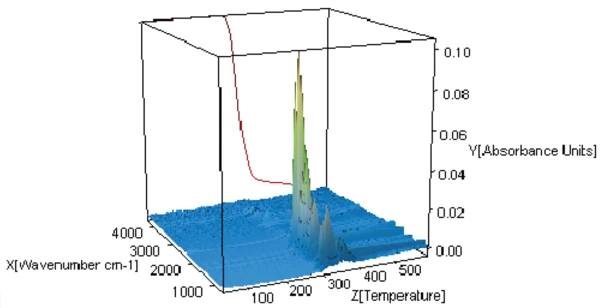
In order to better comprehend the degradation mechanism, the gases released during heating were analyzed by FT-IR. The 3-D plot of figure 3 shows the mass loss (red curve) as well as the FT-IR spectra of the gases released during heating (3-dimensional presentation).
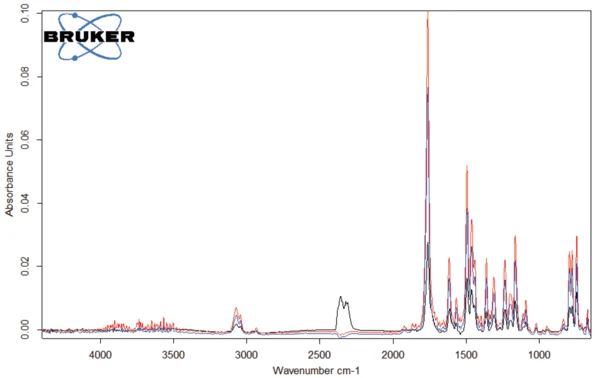
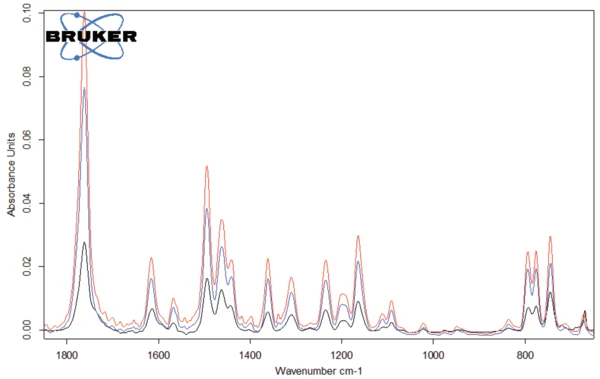
The spectra of the gases released at 301°C, 311°C and 343°C are depicted in figures 4 and 5. It can clearly be seen that these three spectra differ only in intensity of the bands, or rather in the concentration of the products released: There is a continuous increase at the beginning of degradation (blue and red curves) before a decrease takes place (black curve). The only exception to this is the bands between 2300 and 2400 cm-1, indicating the release of CO2 at 343°C (see figure 6).
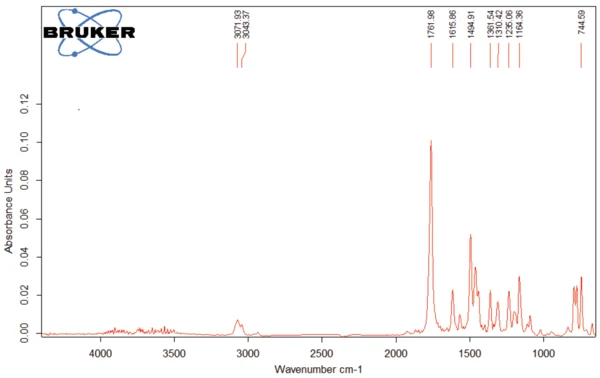
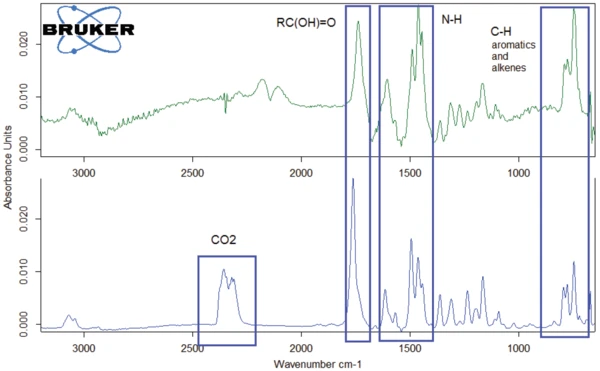
The spectrum of the products released at 311°C (red curves in figures 4 and 5) is given in figure 7. The bands over 3000 cm-1 result from =C-H stretch vibrations. The band at 1761 cm-1 is typical for C=O bonds, whereas the band at 1462 cm-1 indicates the presence of –C-H bonds in the released gases. The bands around 1500 cm-1 denote the volatilization of amine and amide groups. The other detected bands are caused by functional groups containing aromatic groups and chlorine.
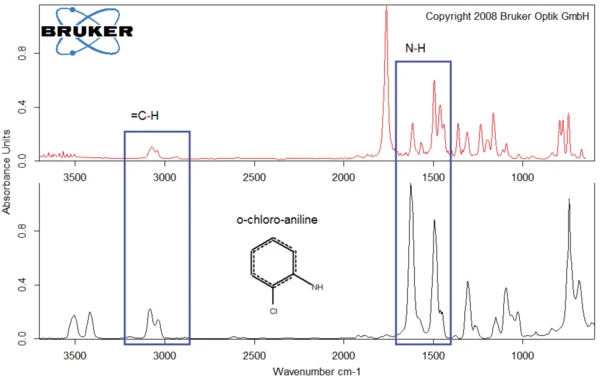
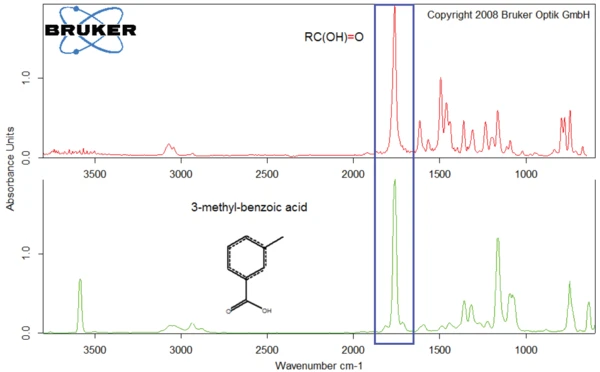
As an example, figures 8 and 9 compare the products released by diclofenac sodium at 311°C with the spectra of o-chloroaniline (figure 8) and of 3-methyl-benzoic acid (figure 9).
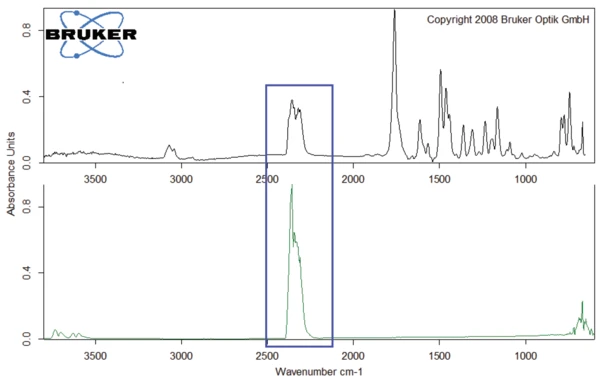
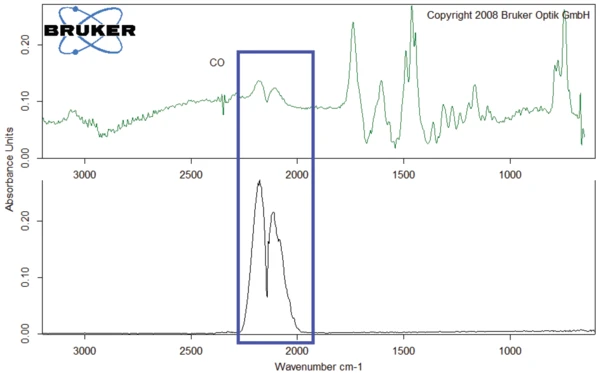
The FT-IR spectrum of the gases released at 526°C is given in figure 10 (dark green curve) along with the spectrum of the gases released at 343°C (blue curve). The curves exhibit similarities to one another. The main difference is the CO2 peak that occurs only in the spectrum at 343°C. In contrast, carbon monoxide was detected only in the spectrum at 526°C (see also figure 11).
Conclusion
Despite the ease with which TGA-FT-IR measurements can be handled, the method provides a lot of information all at once – such as how degradation runs, the temperature at which it begins, and what kinds of substances are released during the process. This makes FT-IR a powerful technology capable of characterizing the stability and composition of pharmaceutical products.