20.05.2020 by Claire Strasser
Fast Compatibility Check by Means of DSC and SuperPosition
Drug-excipient compatibility studies constitute an important phase in the development stage (pre-formulation) of dosage forms. They provide information whether physicochemical interactions happen between API (active pharmaceutical ingredient) and excipients. Differential scanning calorimetry (DSC) and thermogravimetry (TGA) are fast and easy-to-use methods to get first information about Drug-Excipient CompatibilityMedicine is not a single active ingredient but a mixture of the active ingredient with different excipients. In a tablet for example, excipients are used to improve the appearance and taste of the final product, to prevent the tablet from sticking to the punching tool, or to help it dissolve as soon as it is wet, etc.drug-excipient compatibility. For that, DSC and/or TGA measurements are carried out on each component as well as on the mixture of both components (e.g., 50/50 weight). The SuperPosition software feature of the Proteus® analysis software calculates the curve that would be obtained for a mixture if no interaction between the two components occurred. By comparing the measured DSC curve of the mixture and the calculated curve obtained with SuperPosition, one gets fast conclusions about eventual interactions between both ingredients. SuperPosition simulates the curve of a mixture Figure 1 displays the DSC curves of alpha-lactose monohydrate (blue curve), cellulose (black curve) and corn starch (green curve). The broad endothermal peak between room temperature and 150°C in the curves of cellulose and corn starch is typical for the release of surface water contained in these substances. The peak at 144°C in the DSC curve of alpha-lactose monohydrate is due to the release of the crystal water from the sample. Afterwards, alpha-lactose anhydrate melts at 217°C before it transforms into beta-lactose that finally melts and starts to decompose at the end of the measurement.
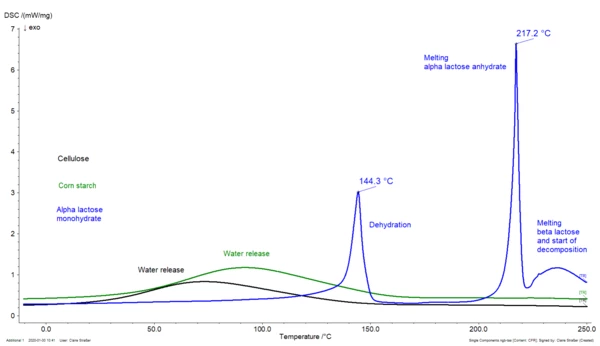
Figure 2 depicts the DSC curve of a mixture containing 3% alpha-lactose monohydrate, 45% cellulose and 19% corn starch (blue curve). The pink curve is the curve calculated by SuperPosition on the basis of the DSC measurements carried out on the single components. This software feature is able to calculate the curve resulting from a mixture of 2 or more substances with desired mass ratios.
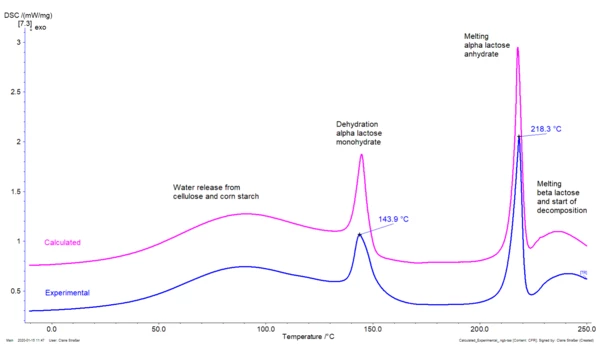
Both curves accord perfectly, showing the good compatibility between the three components. The software feature SuperPosition in combination with DSC or TG measurements brings an exclusive solution to drug/excipient interactions issues.