Tips & Tricks
Rheology for Beginners – Determining the Viscosity of a Hand Cream
The rheological properties of a cream or lotion are closely related to different user expectations:
- Its ability to stay in the tube as long as it is not squeezed
- Its ability to stay where dispensed until it gets rubbed
- Its good flowability during rubbing.
In the following, we will show how measurements with the Kinexus rotational rheometer provide information about this desired behavior of a hand cream.
General Information
A rotational rheometer is typically made up of two parallel plates, between which the sample is loaded. The upper plate rotates, dragging along the sample. The lower plate remains fixed. The Kinexus is typically used to carry out two types of measurements:
Viscometry:
The upper plate turns with a defined shear rate controlled by the gap and rotational speed. As a result, we record the viscosity, η, of the sample, i.e., its resistance to flow.
Oscillation:
The upper plate oscillates with a defined amplitude and frequency. As a result, we get the viscoelastic properties of the sample, described by the elastic shear modulus, G´, the Viscous modulusThe complex modulus (viscous component), loss modulus, or G’’, is the “imaginary” part of the samples the overall complex modulus. This viscous component indicates the liquid like, or out of phase, response of the sample being measurement. loss modulus, G", and the phase angle, δ (to name a few).
Viscometry – How to Quantify the Behavior of the Cream in the Tube, During Squeezing out of the Tube and During Spreading on the Hand

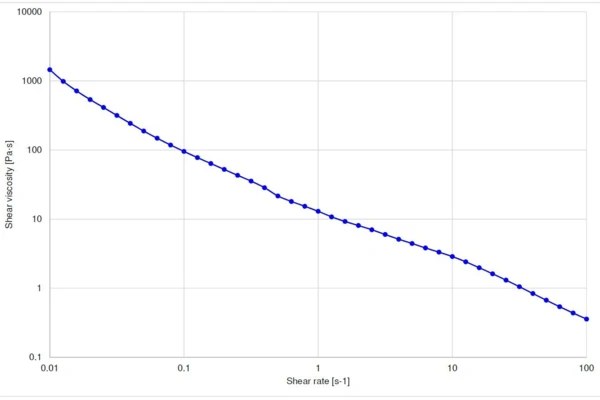
Figure 1 displays the viscosity curve of a commercial hand cream as a function of the applied shear rates. The material shows a shear-thinning behavior: the viscosity decreases with increasing shear rates.
The lower shear rates reflect the behavior of the cream at near rest conditions. The higher viscosity at low shear rates ensures two properties of the product: The cream will not come out of the tube without stress from outside (= squeezing of the tube). Moreover, after dispensing it on the skin, it will remain in the hand without flowing away.
As soon as the user squeezes the tube, higher shear rates are applied to the cream. According to the resulting curve, this leads to a decrease of the product viscosity, so that it flows easily out of the tube. The higher shear rates mimic also the behavior of the cream during spreading on the skin. This process gets easier thanks to the lower viscosity, which results in a smoother feel on the skin. In this context, an important term is the Yield StressYield stress is defined as the stress below which no flow occurs; literally behaves like a weak solid at rest and a liquid when yielded.yield stress, i.e., the minimum stress that has to be applied to a material to induce its flowing.
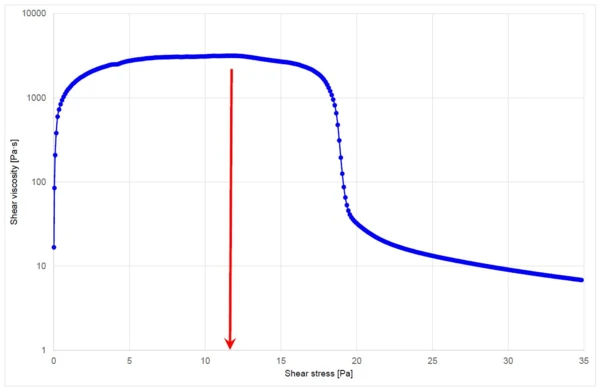
Figure 2 displays the Yield StressYield stress is defined as the stress below which no flow occurs; literally behaves like a weak solid at rest and a liquid when yielded.yield stress measurement on the hand cream. In the lower shear stresses range, we see an apparent increase in the viscosity coming from the sample structure stretching before yielding. The hand cream starts to flow after the peak in viscosity (see red arrow). For this example, there is another transition at higher stress, from which point the viscosity strongly decreases and is free flowing. The software calculates the Yield StressYield stress is defined as the stress below which no flow occurs; literally behaves like a weak solid at rest and a liquid when yielded.yield stress value automatically: the cream would begin to flow from a shear stress of 11.7 Pa.

Oscillation – One Material, Different Behaviors ... Depending on the Time Scale of the Process

Amplitude Sweep
In an oscillation measurement, the sample has to be in the so-called Linear Viscoelastic Region (LVER)In the LVER, applied stresses are insufficient to cause structural breakdown (yielding) of the structure and hence important micro-structural properties are being measured.linear viscoelastic region (Linear Viscoelastic Region (LVER)In the LVER, applied stresses are insufficient to cause structural breakdown (yielding) of the structure and hence important micro-structural properties are being measured.LVER), in which the applied strain or stress doesn´t lead to a breaking of the sample’s associated structure. Therefore, an oscillation test with a defined frequency and a varying amplitude of deformation is carried out on the material in a first step. As a result, the maximum amplitude allowing for a non-destructive test is obtained – the stress or strain limit of the Linear Viscoelastic Region (LVER)In the LVER, applied stresses are insufficient to cause structural breakdown (yielding) of the structure and hence important micro-structural properties are being measured.LVER.
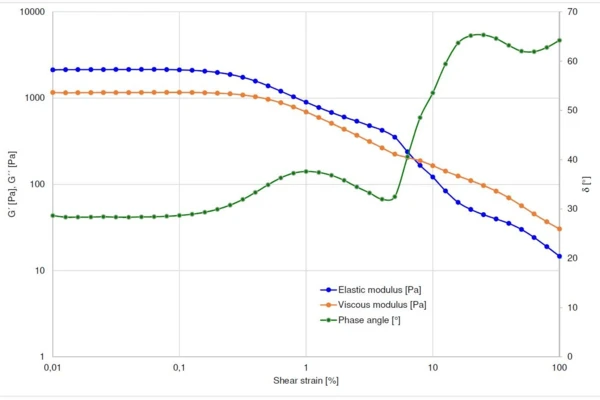
Figure 3 depicts the curves of the Elastic modulusThe complex modulus (elastic component), storage modulus, or G’, is the “real” part of the samples the overall complex modulus. This elastic component indicates the solid like, or in phase, response of the sample being measurement. elastic modulus, G’, and Viscous modulusThe complex modulus (viscous component), loss modulus, or G’’, is the “imaginary” part of the samples the overall complex modulus. This viscous component indicates the liquid like, or out of phase, response of the sample being measurement. viscous modulus, G”, during the amplitude sweep. The Elastic modulusThe complex modulus (elastic component), storage modulus, or G’, is the “real” part of the samples the overall complex modulus. This elastic component indicates the solid like, or in phase, response of the sample being measurement. elastic modulus remains constant up to 0.2%. That means that for deformations lower than 0.2%, the substance is in the Linear Viscoelastic Region (LVER)In the LVER, applied stresses are insufficient to cause structural breakdown (yielding) of the structure and hence important micro-structural properties are being measured.LVER.
Frequency Sweep
In the next measurement, the amplitude is set at 0.1%, while the frequency is varied to investigate the material's response over different timescales. The results are depicted in figure 4.
Over the complete measured frequency range, the G´ values are larger than the G" values: the elastic properties of the cream are more dominant than its viscous properties. The cream doesn´t flow, but behaves like a solid. This can also be seen in the phase angle, which is a scale of fluidity of the sample, from zero being completely solid-like through to 90° indicating perfect liquid-like behavior. Figure 4 shows that this sample remains more solid-like (i.e., phase angle <45°) over the whole range of frequencies tested, i.e., it doesn't flow

Conclusion
A consumer expects from its hand cream almost contradicting behavior: It should behave like a solid to hinder it from running out of the tube before the user squeezes it, and not flow off the user’s hand after being dispensed. However, it should also behave like a liquid during spreading on the skin by flowing freely. The rheology measurements mimic these different scenarios of deformation and no deformation. The viscosity of the cream decreases with increasing shear rates: during squeezing the tube or rubbing the cream on the skin, it feels “lower viscous” than at rest – just as the user expects.