Introduction
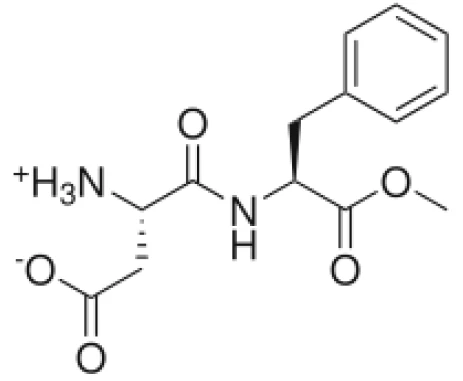
Since its discovery in 1965 by the chemist James L. Schlatter, scientists quarrel over this controversial sweetener. Is it rightly allowed in drinks and other diet products or is it a danger to our health?
Here, it was measured by means of DSC and TGA-FT-IR in order to obtain information about some of its thermal properties such as Melting Temperatures and EnthalpiesThe enthalpy of fusion of a substance, also known as latent heat, is a measure of the energy input, typically heat, which is necessary to convert a substance from solid to liquid state. The melting point of a substance is the temperature at which it changes state from solid (crystalline) to liquid (isotropic melt).melting point and degradation temperature.
Test Results
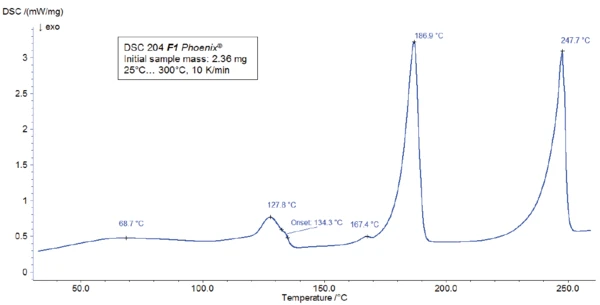
For the DSC measurement, a sample was prepared in a Concavus® crucible with pierced lid and heated between room temperature and 300°C at a heating rate of 10 K/min. The results of the heating are presented in figure 2.
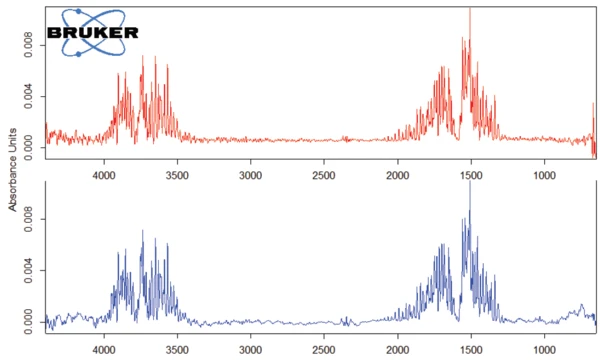
The TGA-FT-IR measurement was carried out on a 7.46-mg sample prepared in an aluminum oxide crucible and heated to 700°C at 10 K/min in a dynamic nitrogen atmosphere. The gases evolved during TGA measurement were directly injected into the FT-IR spectrometer from Bruker Optics. The TGA curve is depicted in figure 3. A broad endothermal effect between 25°C and 100°C (figure 3) is associated with a mass loss of 1.4%. A second endothermal effect detected at 128°C (peak temperature) leads to a mass loss of 1.5%. The corresponding FT-IR spectra at 60°C and 123°C (see figure 4) reveal that the substance released is water in both cases (most probably absorbed water in the first step and hydration water in the second step).
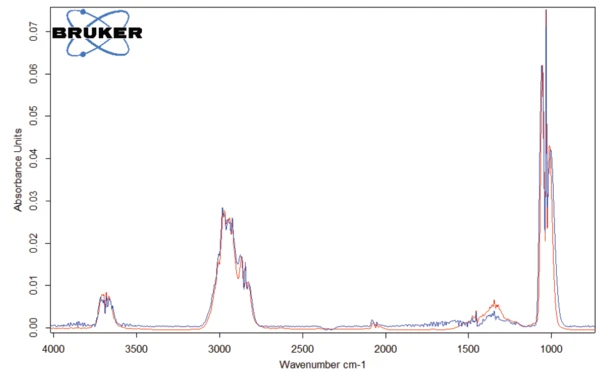
The peak detected at 187°C (DSC), corresponding to the TGA step with a mass loss of 12.5%, is due to the degradation of aspartame. The FT-IR spectrum detected at 184°C is given in figure 5 (blue curve). It corresponds very well to the PNNL library spectrum for methanol (red curve).
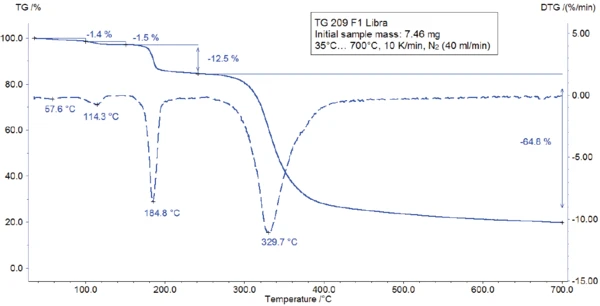
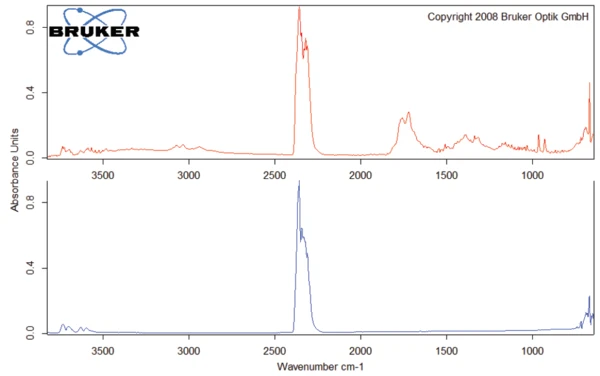
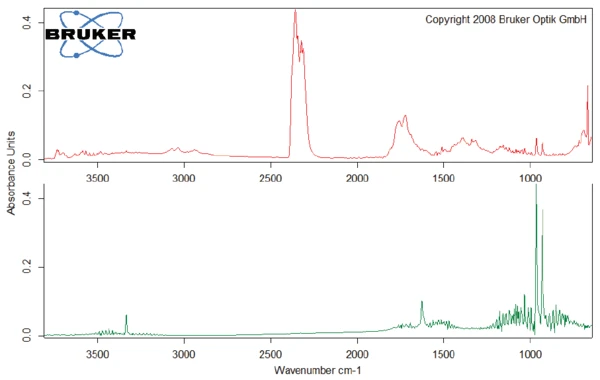
This thermal degradation of aspartame, associated with the release of methanol, leads to the formation of a new substance, presumably 2,5-dioxopiperazine [2]. The peak at 248°C in the DSC curve can be attributed to the melting of the formed substance. Degradation of this product follows (TGA peak at 330°C – fig. 3). Figures 6, 7 and 8 each show the FT-IR spectrum of the products released at 329°C (red curve) in comparison with the FT-IR spectra of different compounds, suggest by the NIST-EPA database. During degradation, carbon dioxide and ammonia are released (blue spectrum in figure 6; green spectrum in figure 7). The other detected bands are most probably caused by functional groups containing aromatic bonds, nitrogen and oxygen.
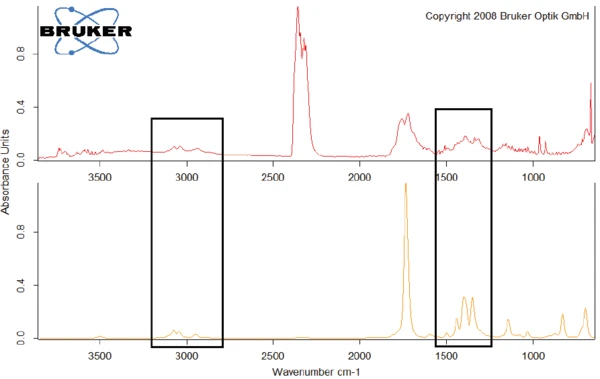
As an example, figure 8 compares the FT-IR spectrum at 329.1°C with the spectrum of N-benzyl-maleimide, with which it shows conformity in the wavelength ranges around 3000 cm-1 and between 1250 cm-1 and 1500 cm-1.
Conclusion
Analysis with the complementary methods of DSC and TGA reveals the amount of volatile components in a sample along with its melting and degradation temperatures. Additionally, FT-IR coupling gives information about the substances released during heating: In the case of aspartame, water evaporates first, and the substance later degrades by releasing methanol.
Although caused by another kind of mechanism, the degradation of aspartame in the body after its consumption also leads to the release of methanol, amongst other emissions. This can lead to headache and dizziness [3], if the substance is taken in high quantities. This is one reason for the recommendation to consume aspartame only advisedly.