POLYMERS
Analysis of Ethylene Vinyl Acetate (EVA) (TGA-FT-IR)
The 3-D plot shows a TGA-FT-IR measurement on an EVA sample between 25°C and 600°C.
The mass-loss steps of the EVA sample (TGA, black curve) correlate well with the absorption intensities between 650 cm-1 and 4000 cm-1. The evolved gases as 2-dimensional spectra can be extracted at any desired temperature and subjected to a library search (e.g., NIST-EPA library for evolved gases) for identification.
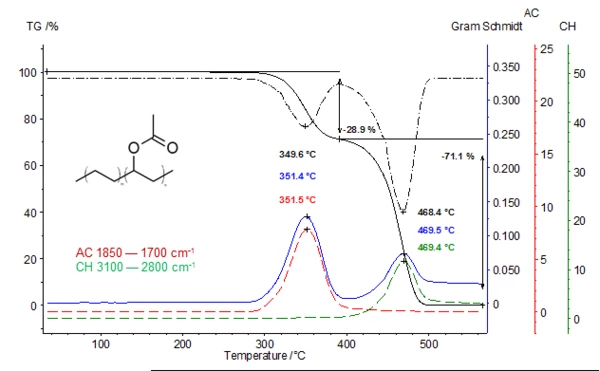
The lower plot shows the TGA (black), DTGA (black dashed) and the Gram-Schmidt graph (blue). The two additional extracted traces (temperature-dependent intensities; red and green curves) are in very good correlation with the DTGA curve. The 1st mass-loss step at 350°C is due to the release of acetic acid (red curve). In the 2nd mass-loss step, acetic acid has already been totally released. The green curve represents the absorption intensities of the released hydrocarbons resulting from the Decomposition reactionA decomposition reaction is a thermally induced reaction of a chemical compound forming solid and/or gaseous products. decomposition of the polymer backbone (DTGA peak at 468°C).
*Gram-Schmidt: Total intensity of the obtained infrared spectra of the gases released